Co-authored by Saurabh Hirani
Reviewed and edited by Spandan Ghosh
Our story begins with a team tasked with setting up CloudWatch alerts for a production AWS EKS (Elastic Kubernetes Service) cluster. The primary goal was to ensure that the cluster nodes were always in a "ready" state, capable of accepting workloads.
The initial challenge
The team began by leveraging AWS Container Insights, which collects, aggregates, and summarizes metrics and logs from containerized applications and microservices. Since the customer did not have Prometheus set up and preferred to use AWS CloudWatch metrics for all alerts, we focused on AWS Container Insights metrics.
We concentrated on the node_status_condition_ready metric described here, which indicates whether a node is ready to accept workloads. If a node is ready, the value of this metric is 1; otherwise, it is 0.
Our initial approach was influenced by PromQL, which we had used previously. This led to some unexpected challenges as we transitioned to CloudWatch.
Static nodes in staging
In the staging environment, the team had a fixed set of 3 EKS nodes. This made it easier to test our alerting strategy. We created individual alarms for each node, triggering an alert if the node_status_condition_ready metric dropped below 1.
Alarm Scenario: If 2 out of 3 nodes became not ready, 2 separate alarms would be triggered, reflecting the issue.
While this approach worked well for a small, static setup, it was clear that it wouldn't scale well for larger, dynamic environments.
Dynamic nodes in load testing
Before moving to production, we tested our strategy on a load testing cluster with auto-scaling enabled. Here the previous approach of setting individual alarms for each node became impractical due to the dynamic nature of the nodes.
This is where CloudWatch Metric Insights proved valuable. We used a query to retrieve the readiness status for all nodes dynamically:
SELECT node_status_condition_ready FROM "ContainerInsights"
We were particularly interested in identifying nodes with a readiness value of 0. so we used:
SELECT MIN(node_status_condition_ready) FROM "ContainerInsights" GROUP BY
However, this produced a multi-time series output, which needed to be aggregated into a single time series for CloudWatch alarms.
When configuring alarms, CloudWatch offers the following aggregation functions:
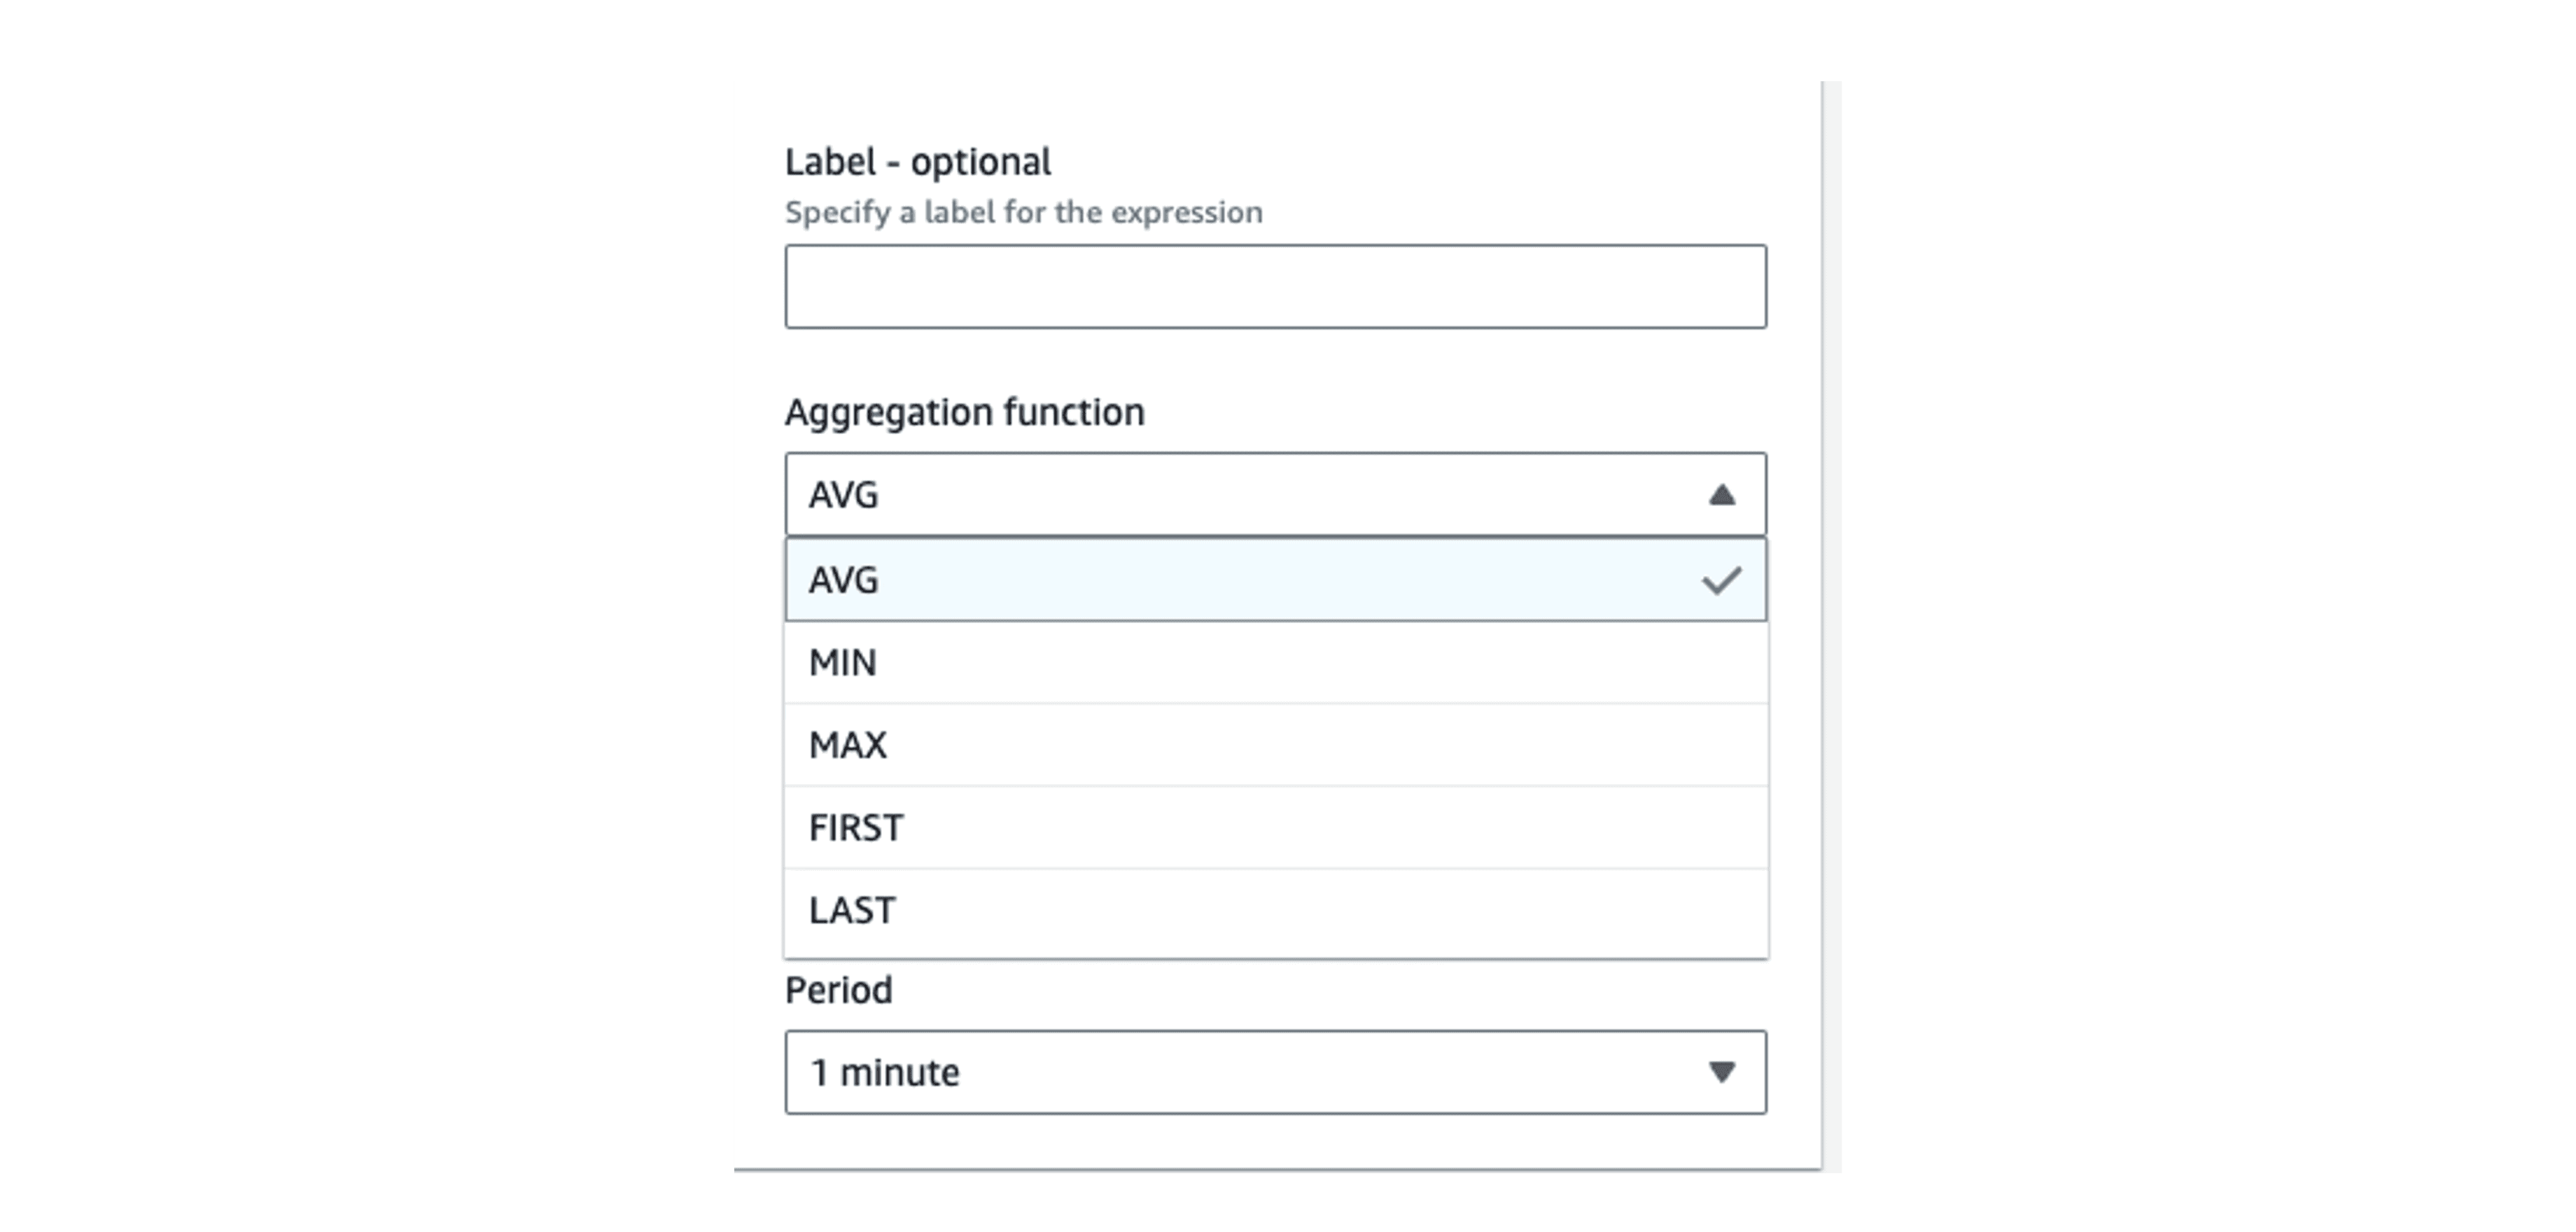
These can be used to consolidate the multi-time series data into a single time series for the alarm.
We used the MIN(MIN) approach to create a single time series indicating whether at least one node was not in the "Ready" state.
Alarm scenario: If at least one node is not ready, the alarm will trigger.
Pros: No need to specify a static list of nodes, making it suitable for dynamic environments.
Cons: Once the alarm triggers, the operator must investigate further in the Cloudwatch dashboard to determine how many nodes are impacted. This introduces an additional level of indirection, meaning that the criticality of the situation can only be assessed after receiving the alert. This might lead to unnecessary wake-up calls for issues that might not be severe enough to warrant immediate action.
Attempt at improving auto-scaled nodes alerting
To create a more balanced alerting strategy that considered the proportion of failing nodes, we needed to assess the question: "One node out of how many?"
By calculating the count or even better, the percentage of failing nodes, we could tailor our alerting response more effectively. This approach allowed us to differentiate between scenarios like 1 out of 2 nodes failing versus 1 out of 100, leading to more appropriate responses and reducing unnecessary alert fatigue.
After consulting with AWS, we found a more refined solution: using Metric Insights to calculate the percentage of faulty nodes.
This is done using the AVG(SUM) approach.
Metric insights query:
SELECT SUM(node_status_condition_ready) FROM "ContainerInsights" GROUP BY
Then apply the AVG(SUM) approach:
👉🏻 Example:
node_1 = 1
node_2 = 1
node_3 = 0
node_4 = 0
SUM(1,1,0,0) = 2 AVG(SUM) = 2/4 = 0.5 => 50% of nodes are not ready.
This seemed logical enough, but when we tested it we ran into an interesting limitation.
The aggregation conundrum
When we delved deeper, we encountered an unexpected issue.
👉🏻 These were the values of the metric in our setup:
node_1 = 1
node_2 = 1
node_3 = 1
node_4 = 1
Expected SUM = 4, Expected AVG = 1 Value obtained for SUM = 8, Value obtained for AVG = 1.6
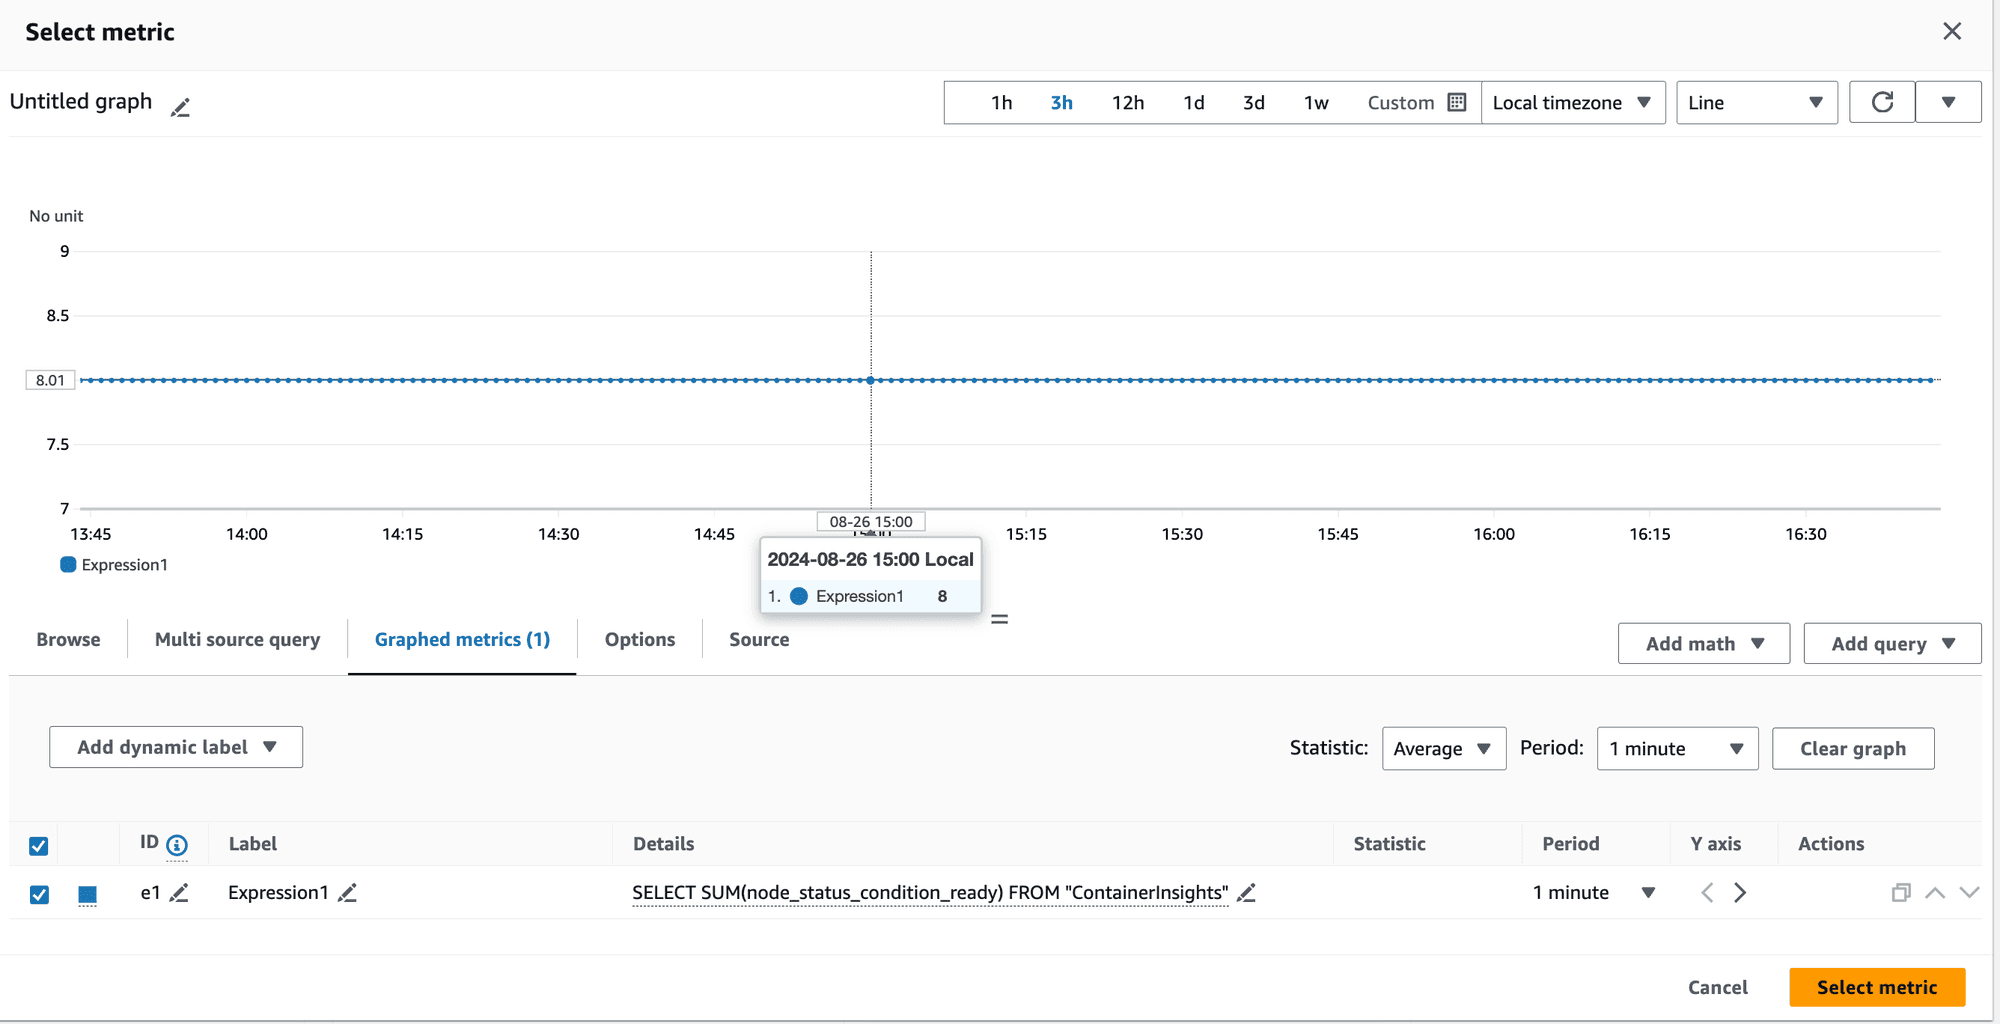
Metrics showing SUM = 8
This was perplexing.
How can the sum of metrics for 4 nodes be 8 when the maximum sum should be 4?
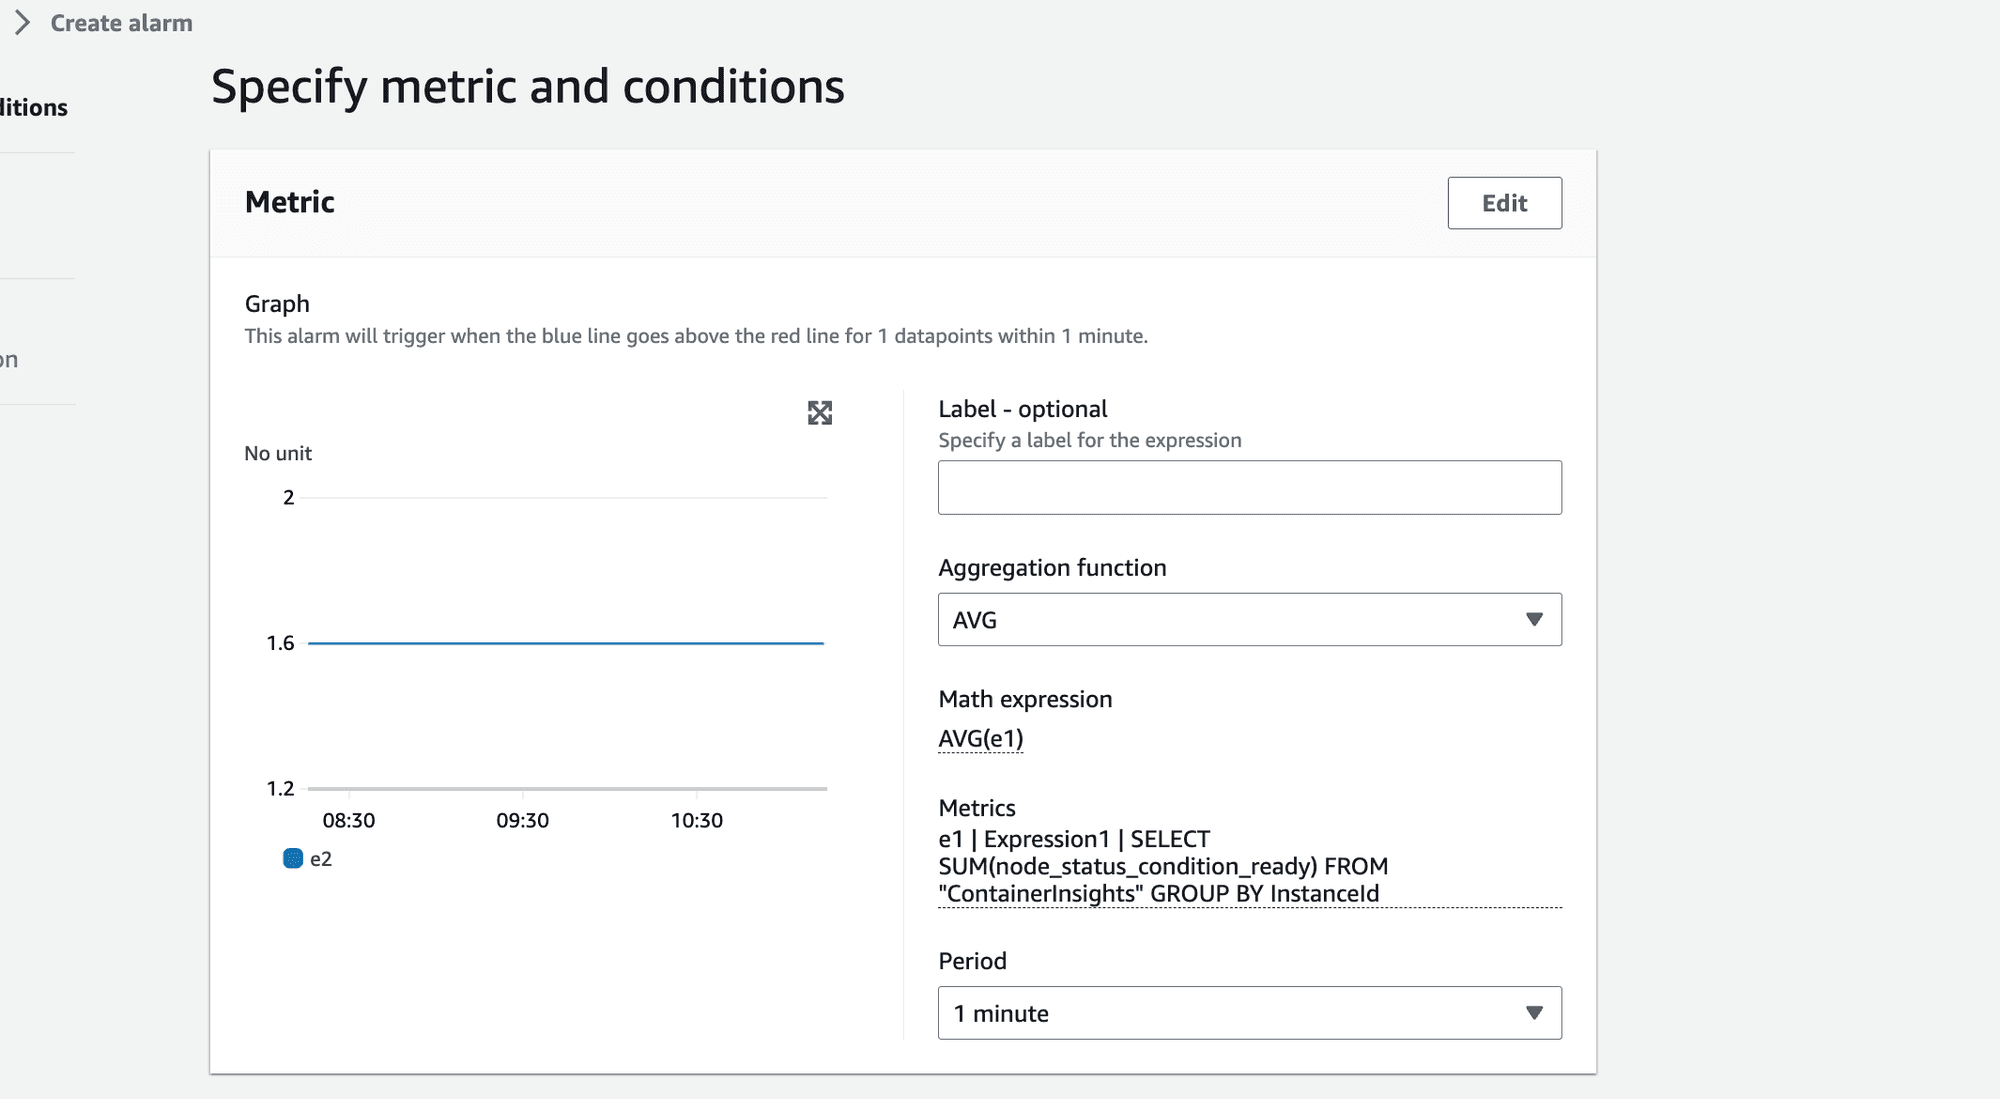
Metrics showing AVG = 1.6
How can the average value be 1.6 when the maximum possible average for 4 nodes is 1?
The root cause lied in CloudWatch Metrics Insights' behavior.
When aggregating metrics, CloudWatch includes a group called "Other," which represents the overall sum of all values.
💡 CloudWatch included this "Other" group in the aggregation, leading to an inflated sum and average:

Original Node Values: 1, 1, 1, 1
Expected SUM: 4
Obtained SUM: 8 (4 + 1 + 1 + 1 + 1)
Expected AVG: 1
Obtained AVG: 1.6 (8/5 instead of 4/4
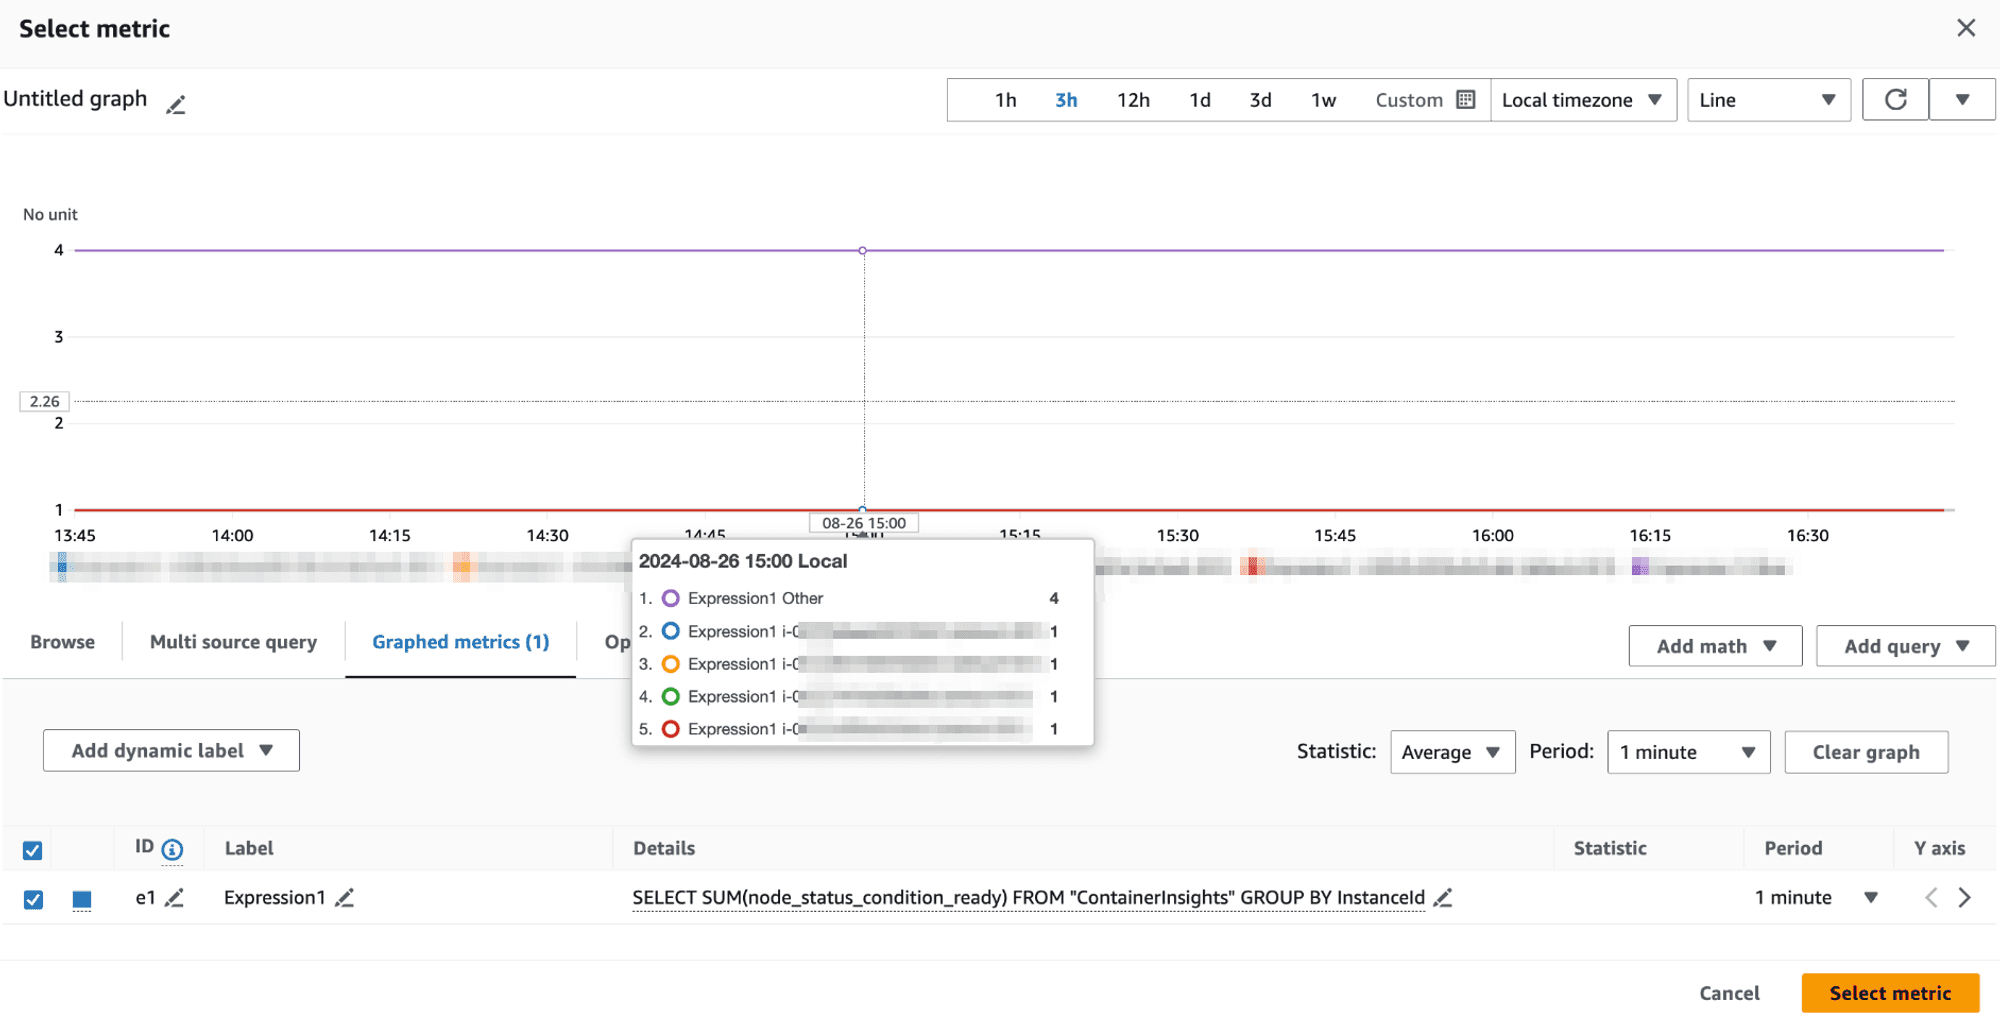
This "Other" group is factored into the SUM, causing unexpectedly high values and skewed averages.
Workaround:
To correct this, we realized that we should be specific about the SCHEMA used in the query. To exclude the Other group we should change our query from
SELECT SUM(node_status_condition_ready) FROM "ContainerInsights" GROUP BY
to
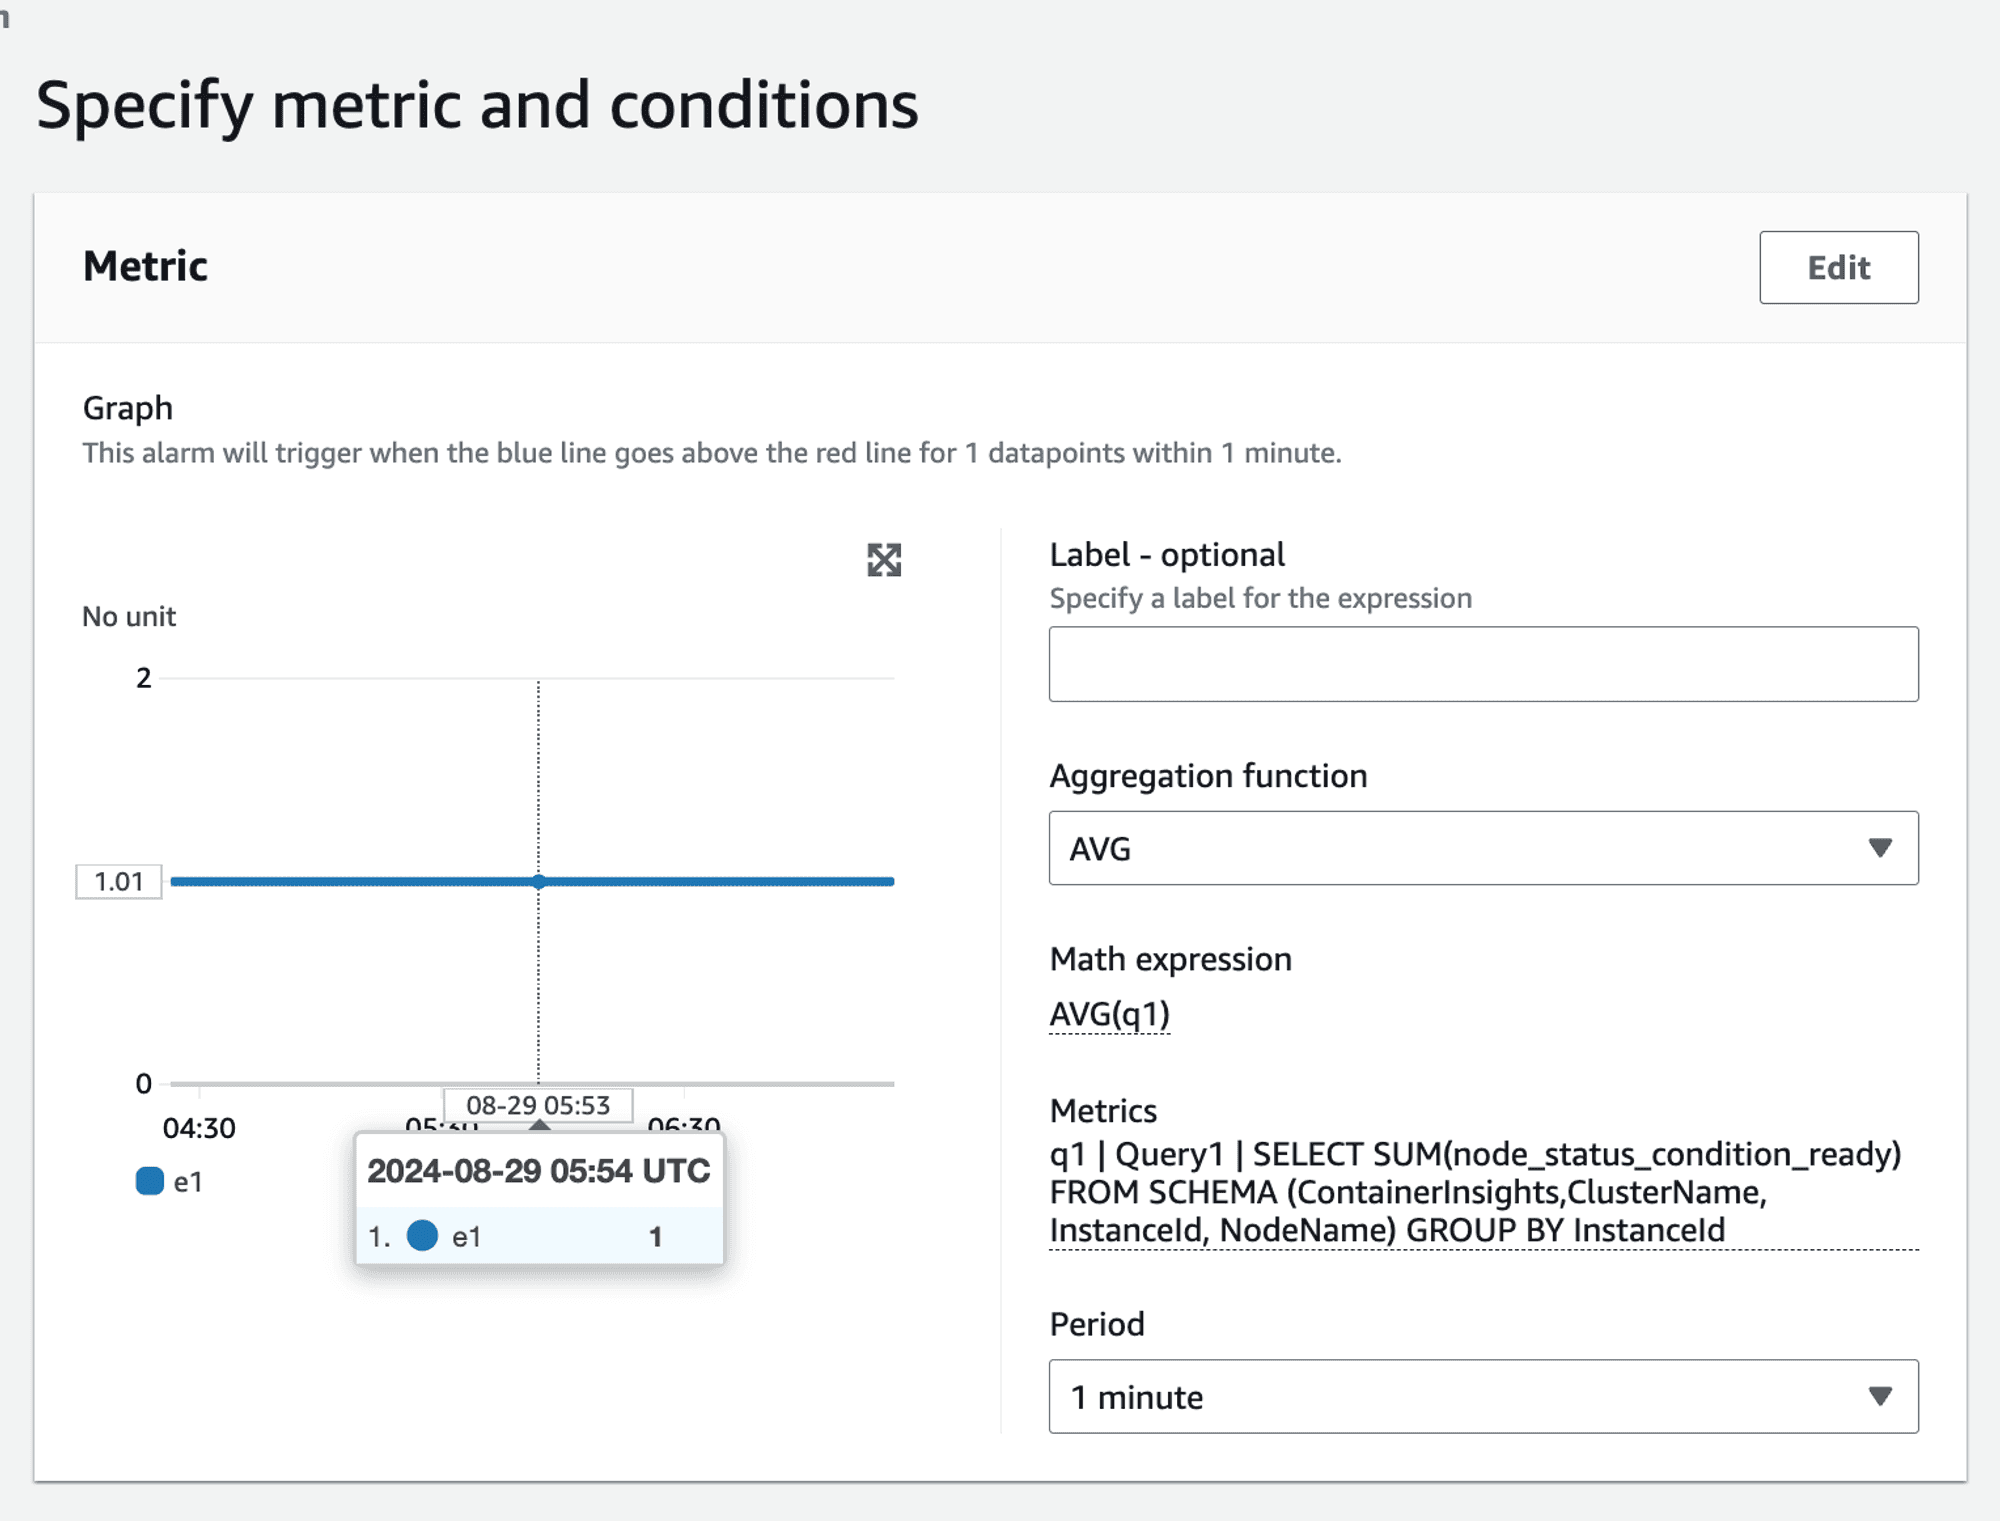
SELECT SUM(node_status_condition_ready) FROM SCHEMA (ContainerInsights,ClusterName, InstanceId, NodeName) GROUP BY
This gave us the right aggregation value when we applied AVG on it. We got the correct value 1 instead of 1.6 invalid value as seen earlier.
Handling non-boolean metrics
The above scenario had the advantage of working with boolean values i.e. the value of the metric was either 1 or 0 . If you need to alert based on non-boolean metrics, such as CPU utilization, the approach becomes more complex. For example, to raise an alarm if more than 50% of nodes have CPU utilization greater than 80%, you cannot directly use the SUM and AVG method:
SELECT AVG(CPUUtilization) FROM SCHEMA("AWS/EC2", InstanceId) GROUP BY
This query would sum up CPU utilization values rather than count the number of nodes exceeding the threshold:
👉🏻 Example:
node_1 = 80
node_2 = 90
node_3 = 10
node_4 = 10
SUM(80,90,10,10) = 190 AVG(SUM) = 190/4 = 47.5 => This does not accurately represent the percentage of nodes with CPU utilization greater than 80%.
It shows the overall average percentage.
Final solution
Given the complexities and limitations encountered, we arrived at a multi-faceted final solution tailored to different scenarios.
For static nodes - use per node alarm1
In environments with a small, static number of nodes, setting individual alarms for each node is feasible. This approach works well when the number of nodes is fixed and manageable.
Alarm Scenario: If 2 out of 3 nodes become not ready, two separate alarms will be triggered, reflecting the issue.
For auto scaled nodes - use Metrics Insights Query with MIN aggregator to alert for at least 1 node failing
For dynamic environments where nodes are scaled in and out, using CloudWatch Metric Insights with a GROUP BY clause is more practical.
SELECT MIN(node_status_condition_ready) FROM "ContainerInsights" GROUP BY
For auto scaled nodes - use Metrics Insights Query with AVG(SUM) aggregator
SELECT SUM(node_status_condition_ready) FROM SCHEMA (ContainerInsights,ClusterName, InstanceId, NodeName) GROUP BY
Handling - non-boolean metrics
This is not possible given the SUM(AVG) aggregation works on metric values and not on metric count.
If we were using PromQL
Using Prometheus would simplify such queries significantly. For instance, to calculate the percentage of nodes that are not ready:
100 * (count(kube_node_status_condition{condition="Ready", status="false"}) / count(kube_node_status_condition{condition="Ready"}))
Similar query will work for counting nodes having CPU utilization greater than a specific threshold. ****
Custom Metric Solution in CloudWatch
To achieve similar functionality in CloudWatch, you would need to create a custom solution using a Lambda function:
Query CPU Utilization: The Lambda function would query the CPU utilization metrics.
Emit Custom Metric: For each node, emit a custom metric
cpu_util_gt_80with a value of 1 if the CPU utilization is greater than 80%, otherwise 0.Use AVG(SUM): Use the
AVG(SUM)approach on the custom metric to calculate the percentage of nodes exceeding the threshold.
This approach adds complexity and incurs additional costs but provides the necessary flexibility for advanced alerting scenarios.
Conclusion and next steps
While CloudWatch Container Insights provides powerful tools for monitoring and alerting, it has limitations, especially in dynamic environments. By understanding these limitations and leveraging the right tools and workarounds, you can create effective alerting strategies.
If you're facing similar challenges or need expert guidance on setting up and managing your AWS EKS clusters with CloudWatch, we are here to help. Our team specializes in providing comprehensive solutions for AWS monitoring, logging, and alerting.
Contact us today to learn more about how One2N can help you streamline your AWS operations and ensure your applications are always running smoothly.
By leveraging our expertise, you can focus on what matters most – delivering high-quality applications and services to your users.
Co-authored by Saurabh Hirani
Reviewed and edited by Spandan Ghosh
Our story begins with a team tasked with setting up CloudWatch alerts for a production AWS EKS (Elastic Kubernetes Service) cluster. The primary goal was to ensure that the cluster nodes were always in a "ready" state, capable of accepting workloads.
The initial challenge
The team began by leveraging AWS Container Insights, which collects, aggregates, and summarizes metrics and logs from containerized applications and microservices. Since the customer did not have Prometheus set up and preferred to use AWS CloudWatch metrics for all alerts, we focused on AWS Container Insights metrics.
We concentrated on the node_status_condition_ready metric described here, which indicates whether a node is ready to accept workloads. If a node is ready, the value of this metric is 1; otherwise, it is 0.
Our initial approach was influenced by PromQL, which we had used previously. This led to some unexpected challenges as we transitioned to CloudWatch.
Static nodes in staging
In the staging environment, the team had a fixed set of 3 EKS nodes. This made it easier to test our alerting strategy. We created individual alarms for each node, triggering an alert if the node_status_condition_ready metric dropped below 1.
Alarm Scenario: If 2 out of 3 nodes became not ready, 2 separate alarms would be triggered, reflecting the issue.
While this approach worked well for a small, static setup, it was clear that it wouldn't scale well for larger, dynamic environments.
Dynamic nodes in load testing
Before moving to production, we tested our strategy on a load testing cluster with auto-scaling enabled. Here the previous approach of setting individual alarms for each node became impractical due to the dynamic nature of the nodes.
This is where CloudWatch Metric Insights proved valuable. We used a query to retrieve the readiness status for all nodes dynamically:
SELECT node_status_condition_ready FROM "ContainerInsights"
We were particularly interested in identifying nodes with a readiness value of 0. so we used:
SELECT MIN(node_status_condition_ready) FROM "ContainerInsights" GROUP BY
However, this produced a multi-time series output, which needed to be aggregated into a single time series for CloudWatch alarms.
When configuring alarms, CloudWatch offers the following aggregation functions:
These can be used to consolidate the multi-time series data into a single time series for the alarm.
We used the MIN(MIN) approach to create a single time series indicating whether at least one node was not in the "Ready" state.
Alarm scenario: If at least one node is not ready, the alarm will trigger.
Pros: No need to specify a static list of nodes, making it suitable for dynamic environments.
Cons: Once the alarm triggers, the operator must investigate further in the Cloudwatch dashboard to determine how many nodes are impacted. This introduces an additional level of indirection, meaning that the criticality of the situation can only be assessed after receiving the alert. This might lead to unnecessary wake-up calls for issues that might not be severe enough to warrant immediate action.
Attempt at improving auto-scaled nodes alerting
To create a more balanced alerting strategy that considered the proportion of failing nodes, we needed to assess the question: "One node out of how many?"
By calculating the count or even better, the percentage of failing nodes, we could tailor our alerting response more effectively. This approach allowed us to differentiate between scenarios like 1 out of 2 nodes failing versus 1 out of 100, leading to more appropriate responses and reducing unnecessary alert fatigue.
After consulting with AWS, we found a more refined solution: using Metric Insights to calculate the percentage of faulty nodes.
This is done using the AVG(SUM) approach.
Metric insights query:
SELECT SUM(node_status_condition_ready) FROM "ContainerInsights" GROUP BY
Then apply the AVG(SUM) approach:
👉🏻 Example:
node_1 = 1
node_2 = 1
node_3 = 0
node_4 = 0
SUM(1,1,0,0) = 2 AVG(SUM) = 2/4 = 0.5 => 50% of nodes are not ready.
This seemed logical enough, but when we tested it we ran into an interesting limitation.
The aggregation conundrum
When we delved deeper, we encountered an unexpected issue.
👉🏻 These were the values of the metric in our setup:
node_1 = 1
node_2 = 1
node_3 = 1
node_4 = 1
Expected SUM = 4, Expected AVG = 1 Value obtained for SUM = 8, Value obtained for AVG = 1.6
Metrics showing SUM = 8
This was perplexing.
How can the sum of metrics for 4 nodes be 8 when the maximum sum should be 4?
Metrics showing AVG = 1.6
How can the average value be 1.6 when the maximum possible average for 4 nodes is 1?
The root cause lied in CloudWatch Metrics Insights' behavior.
When aggregating metrics, CloudWatch includes a group called "Other," which represents the overall sum of all values.
💡 CloudWatch included this "Other" group in the aggregation, leading to an inflated sum and average:

Original Node Values: 1, 1, 1, 1
Expected SUM: 4
Obtained SUM: 8 (4 + 1 + 1 + 1 + 1)
Expected AVG: 1
Obtained AVG: 1.6 (8/5 instead of 4/4
This "Other" group is factored into the SUM, causing unexpectedly high values and skewed averages.
Workaround:
To correct this, we realized that we should be specific about the SCHEMA used in the query. To exclude the Other group we should change our query from
SELECT SUM(node_status_condition_ready) FROM "ContainerInsights" GROUP BY
to
SELECT SUM(node_status_condition_ready) FROM SCHEMA (ContainerInsights,ClusterName, InstanceId, NodeName) GROUP BY
This gave us the right aggregation value when we applied AVG on it. We got the correct value 1 instead of 1.6 invalid value as seen earlier.
Handling non-boolean metrics
The above scenario had the advantage of working with boolean values i.e. the value of the metric was either 1 or 0 . If you need to alert based on non-boolean metrics, such as CPU utilization, the approach becomes more complex. For example, to raise an alarm if more than 50% of nodes have CPU utilization greater than 80%, you cannot directly use the SUM and AVG method:
SELECT AVG(CPUUtilization) FROM SCHEMA("AWS/EC2", InstanceId) GROUP BY
This query would sum up CPU utilization values rather than count the number of nodes exceeding the threshold:
👉🏻 Example:
node_1 = 80
node_2 = 90
node_3 = 10
node_4 = 10
SUM(80,90,10,10) = 190 AVG(SUM) = 190/4 = 47.5 => This does not accurately represent the percentage of nodes with CPU utilization greater than 80%.
It shows the overall average percentage.
Final solution
Given the complexities and limitations encountered, we arrived at a multi-faceted final solution tailored to different scenarios.
For static nodes - use per node alarm1
In environments with a small, static number of nodes, setting individual alarms for each node is feasible. This approach works well when the number of nodes is fixed and manageable.
Alarm Scenario: If 2 out of 3 nodes become not ready, two separate alarms will be triggered, reflecting the issue.
For auto scaled nodes - use Metrics Insights Query with MIN aggregator to alert for at least 1 node failing
For dynamic environments where nodes are scaled in and out, using CloudWatch Metric Insights with a GROUP BY clause is more practical.
SELECT MIN(node_status_condition_ready) FROM "ContainerInsights" GROUP BY
For auto scaled nodes - use Metrics Insights Query with AVG(SUM) aggregator
SELECT SUM(node_status_condition_ready) FROM SCHEMA (ContainerInsights,ClusterName, InstanceId, NodeName) GROUP BY
Handling - non-boolean metrics
This is not possible given the SUM(AVG) aggregation works on metric values and not on metric count.
If we were using PromQL
Using Prometheus would simplify such queries significantly. For instance, to calculate the percentage of nodes that are not ready:
100 * (count(kube_node_status_condition{condition="Ready", status="false"}) / count(kube_node_status_condition{condition="Ready"}))
Similar query will work for counting nodes having CPU utilization greater than a specific threshold. ****
Custom Metric Solution in CloudWatch
To achieve similar functionality in CloudWatch, you would need to create a custom solution using a Lambda function:
Query CPU Utilization: The Lambda function would query the CPU utilization metrics.
Emit Custom Metric: For each node, emit a custom metric
cpu_util_gt_80with a value of 1 if the CPU utilization is greater than 80%, otherwise 0.Use AVG(SUM): Use the
AVG(SUM)approach on the custom metric to calculate the percentage of nodes exceeding the threshold.
This approach adds complexity and incurs additional costs but provides the necessary flexibility for advanced alerting scenarios.
Conclusion and next steps
While CloudWatch Container Insights provides powerful tools for monitoring and alerting, it has limitations, especially in dynamic environments. By understanding these limitations and leveraging the right tools and workarounds, you can create effective alerting strategies.
If you're facing similar challenges or need expert guidance on setting up and managing your AWS EKS clusters with CloudWatch, we are here to help. Our team specializes in providing comprehensive solutions for AWS monitoring, logging, and alerting.
Contact us today to learn more about how One2N can help you streamline your AWS operations and ensure your applications are always running smoothly.
By leveraging our expertise, you can focus on what matters most – delivering high-quality applications and services to your users.
In this post
In this post
Section
Share
Share
In this post
section
Share
Keywords
aws cloudwatch, eks cluster monitoring, cloudwatch alerts, cloudwatch eks integration, kubernetes eks alerts, eks cluster health, managed kubernetes cloudwatch, cloudwatch alarm configuration, aws logging eks, cloudwatch metrics eks, aws sns alerts, eks performance monitoring, cloud observability aws, eks troubleshooting, alert automation aws, one2n cloudwatch, eks insight dashboard, cloudwatch best practices, eks logging solutions, infrastructure alerts eks, aws security monitoring, cloud native monitoring, devops eks cloudwatch, cloudwatch integration guide