Context.
The client provides Credit Insights to Financial Institutions and NBFCs across South East Asia.
They have 15 deployments across AWS and GCP and six on-premise data centers in different geographies.
Every on-premise has 40+ bare-metal machines, and every cloud deployment has 10+ VMs with 30+ microservices.
Problem Statement.
Monitor CPU, Memory, and Disk Utilization of the host systems and application containers. We needed a uniform solution to fetch metrics across AWS, GCP and on-premise data centers.
Monitor CPU, Memory, and Disk Utilization of the host systems and application containers. We needed a uniform solution to fetch metrics across AWS, GCP and on-premise data centers.
Monitor CPU, Memory, and Disk Utilization of the host systems and application containers. We needed a uniform solution to fetch metrics across AWS, GCP and on-premise data centers.
All metrics should be stored and served from a single storage backend for uniformity, visualization and alerting.
All metrics should be stored and served from a single storage backend for uniformity, visualization and alerting.
All metrics should be stored and served from a single storage backend for uniformity, visualization and alerting.
Set alerts on certain utilization thresholds for Host, CPU and Disk. Set alerts on machine restart or container restart.
Set alerts on certain utilization thresholds for Host, CPU and Disk. Set alerts on machine restart or container restart.
Set alerts on certain utilization thresholds for Host, CPU and Disk. Set alerts on machine restart or container restart.
Alerts should be configured and raised through a single channel.
Alerts should be configured and raised through a single channel.
Alerts should be configured and raised through a single channel.
The system should handle up to 2,000 metric events per minute.
The system should handle up to 2,000 metric events per minute.
The system should handle up to 2,000 metric events per minute.
Outcome/Impact.
Homogenous solution for monitoring and alerting for deployments across cloud and on-premise data centers.
Homogenous solution for monitoring and alerting for deployments across cloud and on-premise data centers.
Homogenous solution for monitoring and alerting for deployments across cloud and on-premise data centers.
Homogenous solution for monitoring and alerting for deployments across cloud and on-premise data centers.
Solution.
Every deployment (Cloud or On-Premise) had its own Nomad cluster for scheduling workloads. Prometheus and StatsD exporter were used for metrics collection.
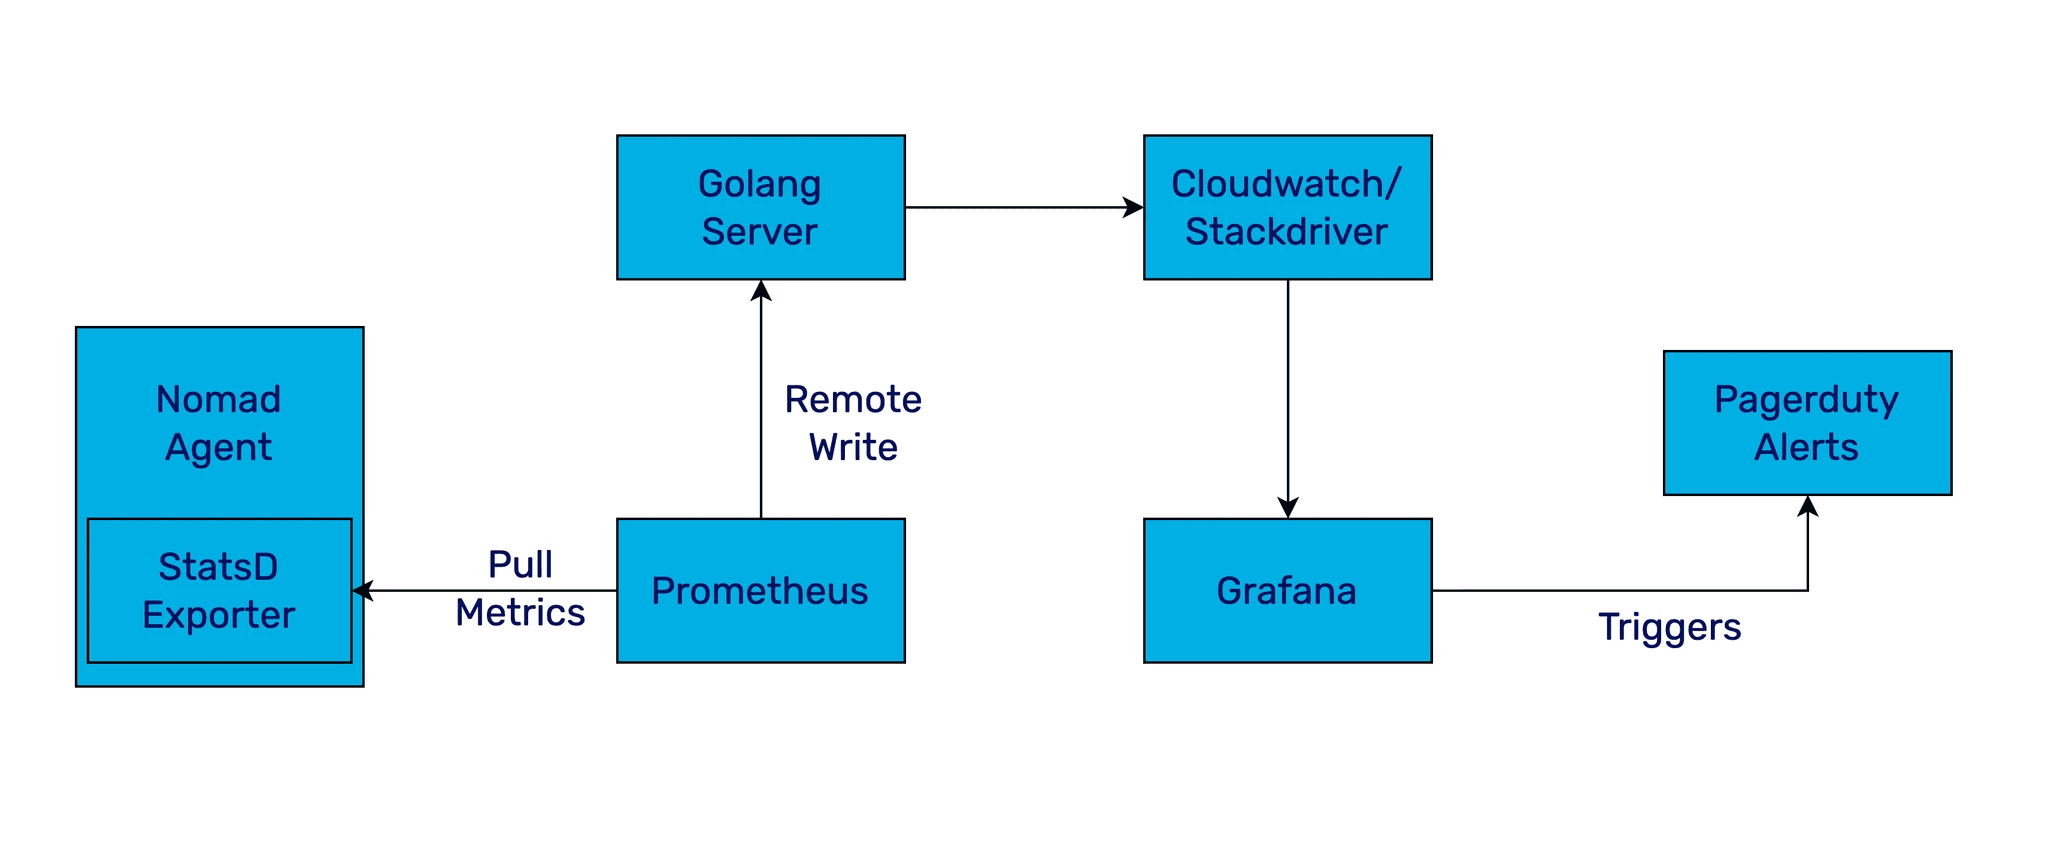
Configured nomad agent and servers to emit metrics to StatsD exporter over UDP. Configure Prometheus to scrape from StatsD exporter HTTP endpoint. This allowed us to set up monitoring for new VMs without having to restart Prometheus.
Configure Prometheus to write metrics to a custom golang HTTP remote service. The service then forwards these metrics to Cloudwatch or Stackdriver. This allowed us to scale Prometheus by using the underlying Cloudwatch or Stackdriver as a remote backend.
Host and service monitoring alert created using terraform scripts integrated with Pagerduty.
Use Grafana for visualizations with Cloudwatch and Stackdriver as backends.
Configure custom alerts via Grafana with Pagerduty Integration.
On-premise / cloud monitoring.

Tech stack used.


Every deployment (Cloud or On-Premise) had its own Nomad cluster for scheduling workloads. Prometheus and StatsD exporter were used for metrics collection.
Configured nomad agent and servers to emit metrics to StatsD exporter over UDP. Configure Prometheus to scrape from StatsD exporter HTTP endpoint. This allowed us to set up monitoring for new VMs without having to restart Prometheus.
Configure Prometheus to write metrics to a custom golang HTTP remote service. The service then forwards these metrics to Cloudwatch or Stackdriver. This allowed us to scale Prometheus by using the underlying Cloudwatch or Stackdriver as a remote backend.
Host and service monitoring alert created using terraform scripts integrated with Pagerduty.
Use Grafana for visualizations with Cloudwatch and Stackdriver as backends.
Configure custom alerts via Grafana with Pagerduty Integration.
On-premise / cloud monitoring.

Tech stack used.


Every deployment (Cloud or On-Premise) had its own Nomad cluster for scheduling workloads. Prometheus and StatsD exporter were used for metrics collection.
Configured nomad agent and servers to emit metrics to StatsD exporter over UDP. Configure Prometheus to scrape from StatsD exporter HTTP endpoint. This allowed us to set up monitoring for new VMs without having to restart Prometheus.
Configure Prometheus to write metrics to a custom golang HTTP remote service. The service then forwards these metrics to Cloudwatch or Stackdriver. This allowed us to scale Prometheus by using the underlying Cloudwatch or Stackdriver as a remote backend.
Host and service monitoring alert created using terraform scripts integrated with Pagerduty.
Use Grafana for visualizations with Cloudwatch and Stackdriver as backends.
Configure custom alerts via Grafana with Pagerduty Integration.
On-premise / cloud monitoring.

Tech stack used.


