As observability moves from a nice-to-have to a must-have, decisions about how you architect your telemetry pipeline can make or break your reliability. By now, if you’ve followed our Otel blog series, you already know the what, the why, and the nitty-gritty of OpenTelemetry. This part of your journey is all about answering a tough question: how should you actually run the OpenTelemetry Collector in your Kubernetes environment?
Why deployment patterns matter
Imagine you’re running a fast-growing web app. Every team says their stack is healthy, but customer complaints keep rolling in. Where do you start investigating? Only properly deployed observability unlocks real answers that is if your deployment pattern fits your needs.
The OpenTelemetry Collector acts as the core of your telemetry pipeline. How you deploy it shapes:
Resource efficiency: The wrong setup wastes CPU, memory, or network.
Scalability: Can your approach handle growth, or will telemetry lag behind?
Operational complexity: Some methods need a lot of manual work; others, almost none.
Let’s walk through the main deployment models and see what works best in practice.
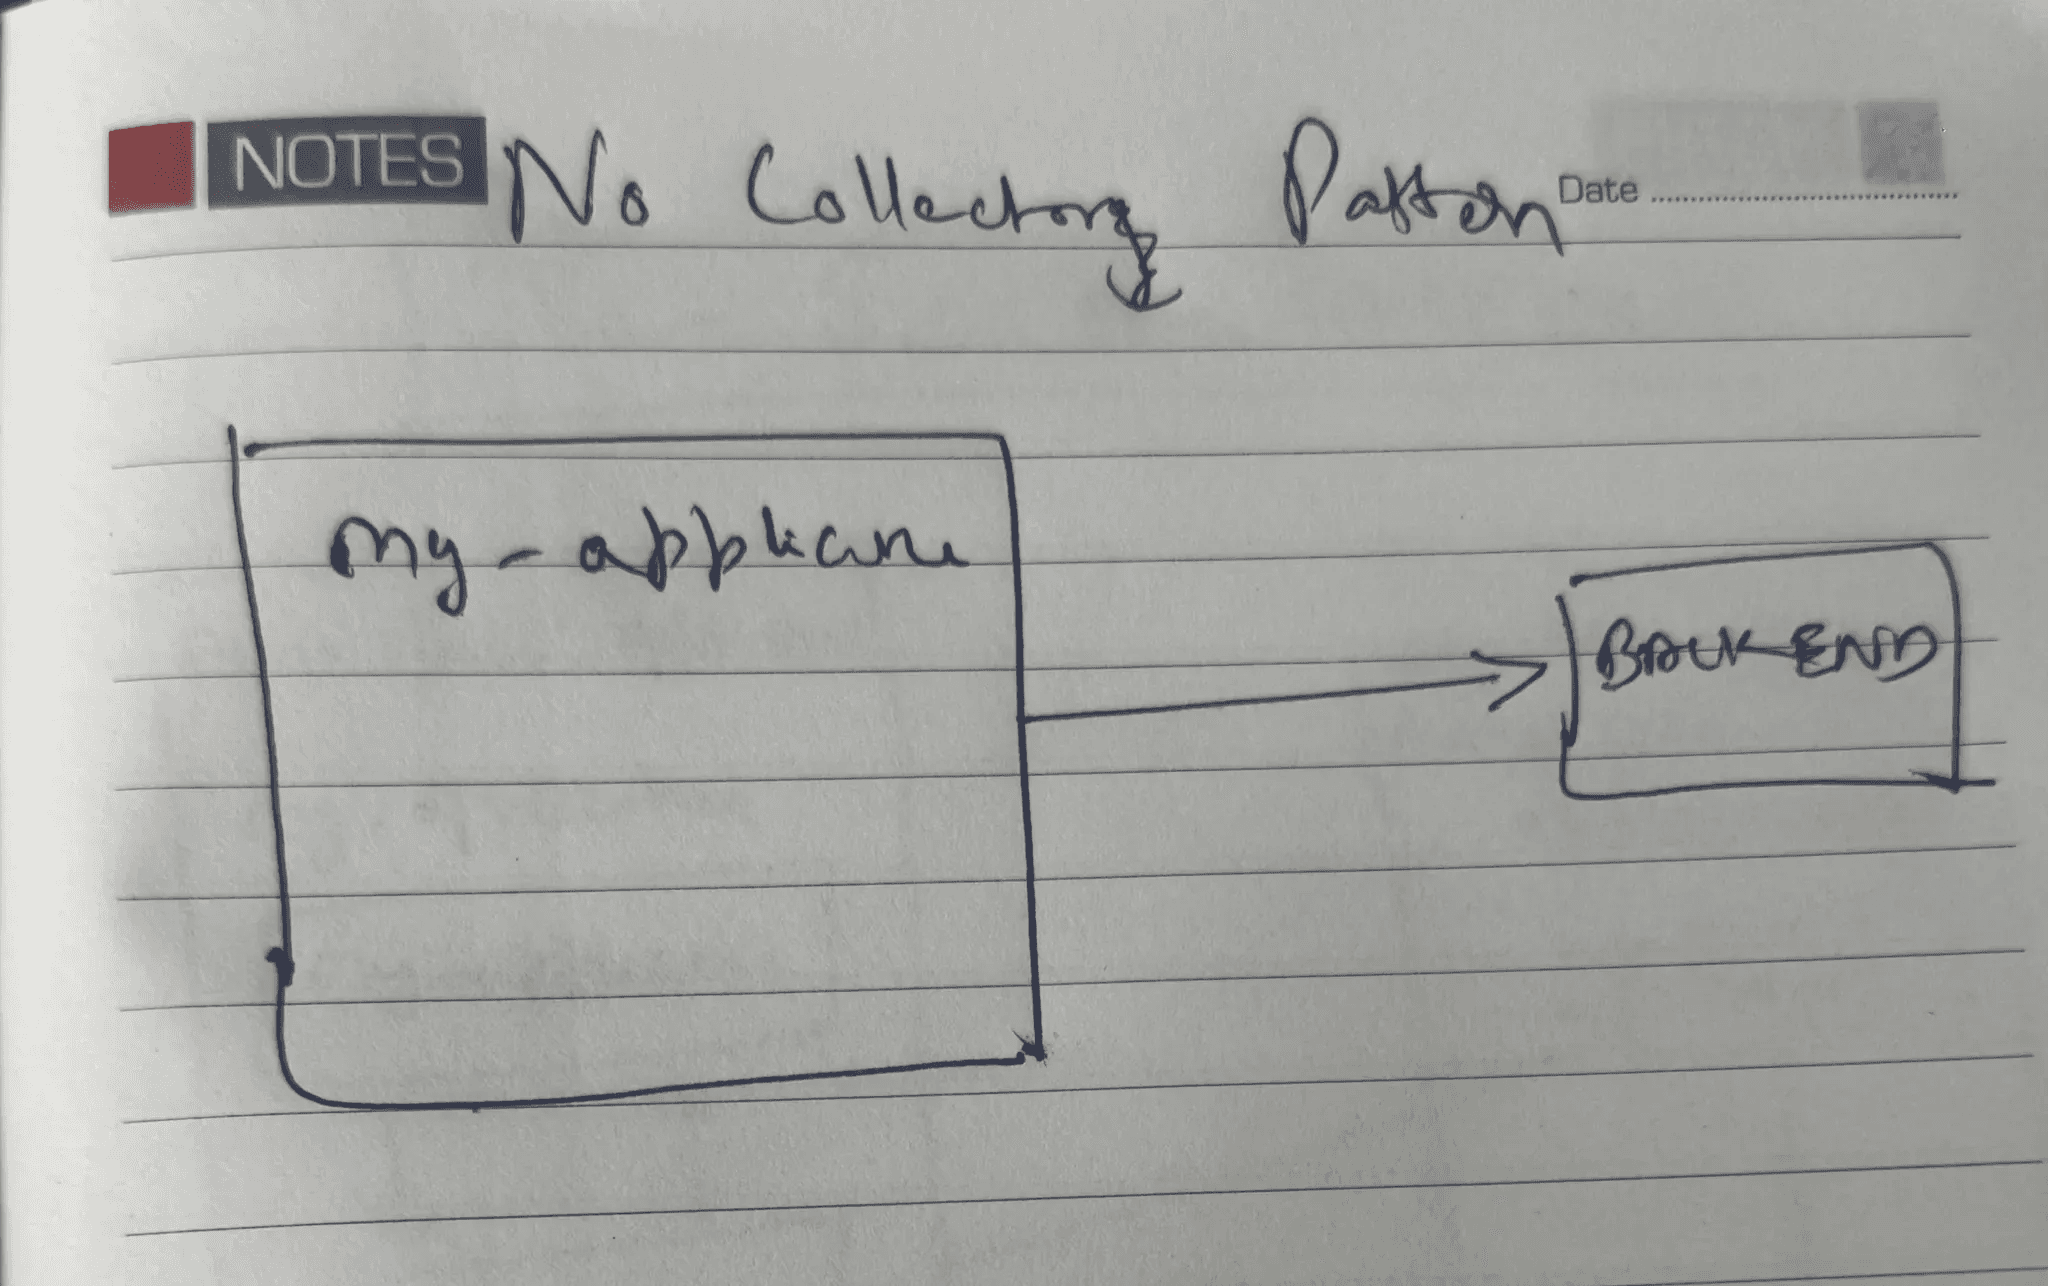
1. No collector pattern
How it works:
Your application sends telemetry directly to your backend (like Prometheus or New Relic), skipping a Collector layer altogether.
Advantages:
Simplest possible setup
No collector to configure or manage
Trade-offs:
Hard to enrich or process data
Tightly couples your app to backend protocols and vendors
Best for:
Very simple use cases; backends that fully support your app’s telemetry format.
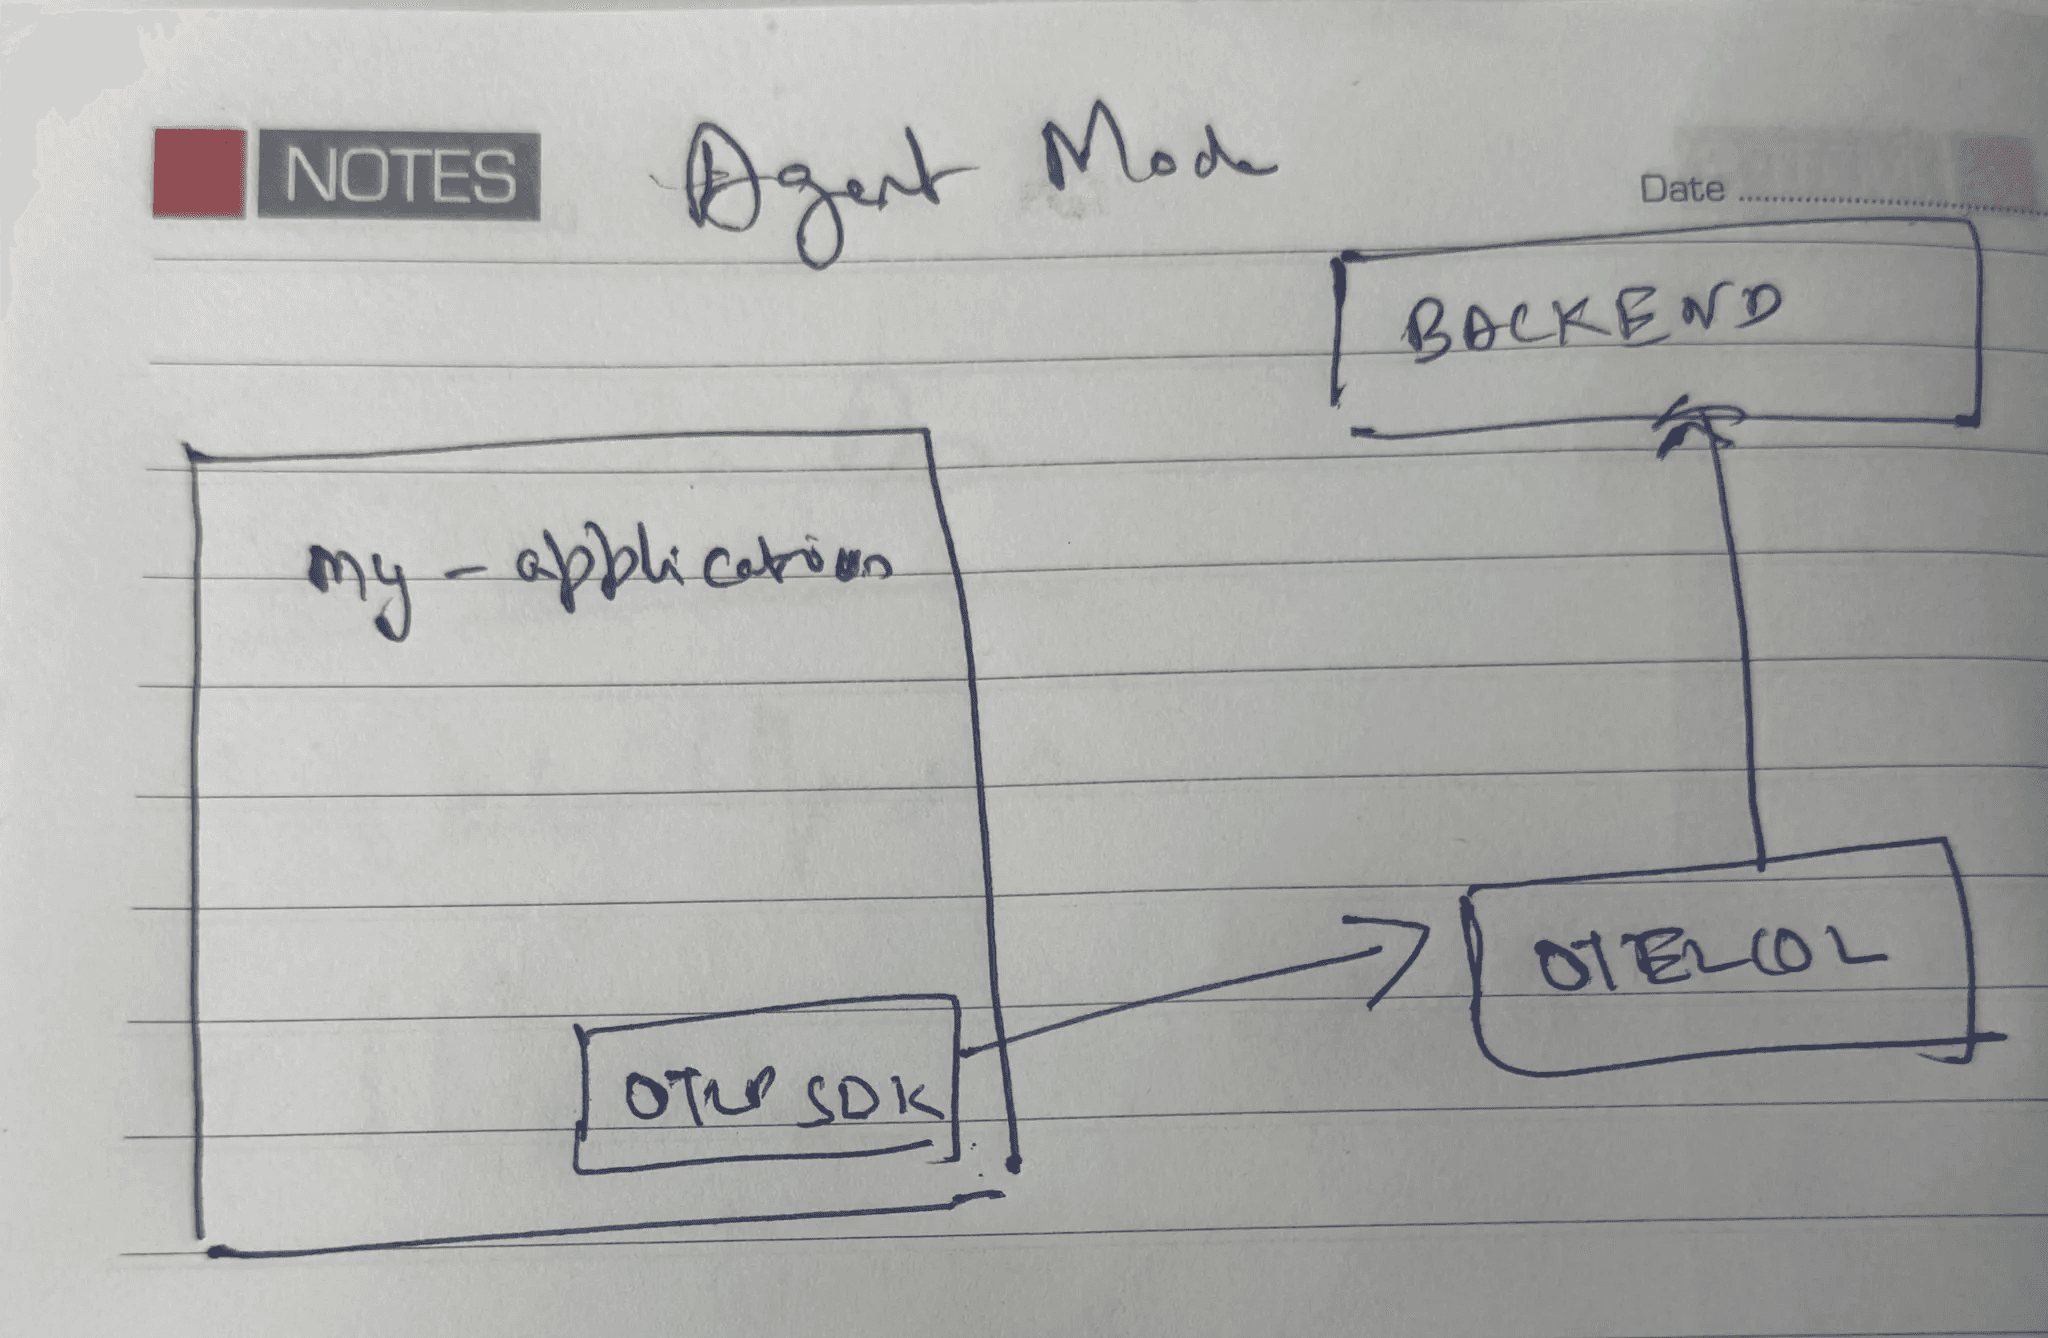
2. Agent pattern
How it works:
A Collector runs as a lightweight agent within each pod or node, handling telemetry before it leaves the environment.
Advantages:
Decouples applications from backend details
Enables local sampling, batching, or enrichment
Trade-offs:
Adds some compute overhead
Slightly more moving parts to maintain
Best for:
Pre-processing needs or when direct integration isn’t practical.
3. Sidecar pattern
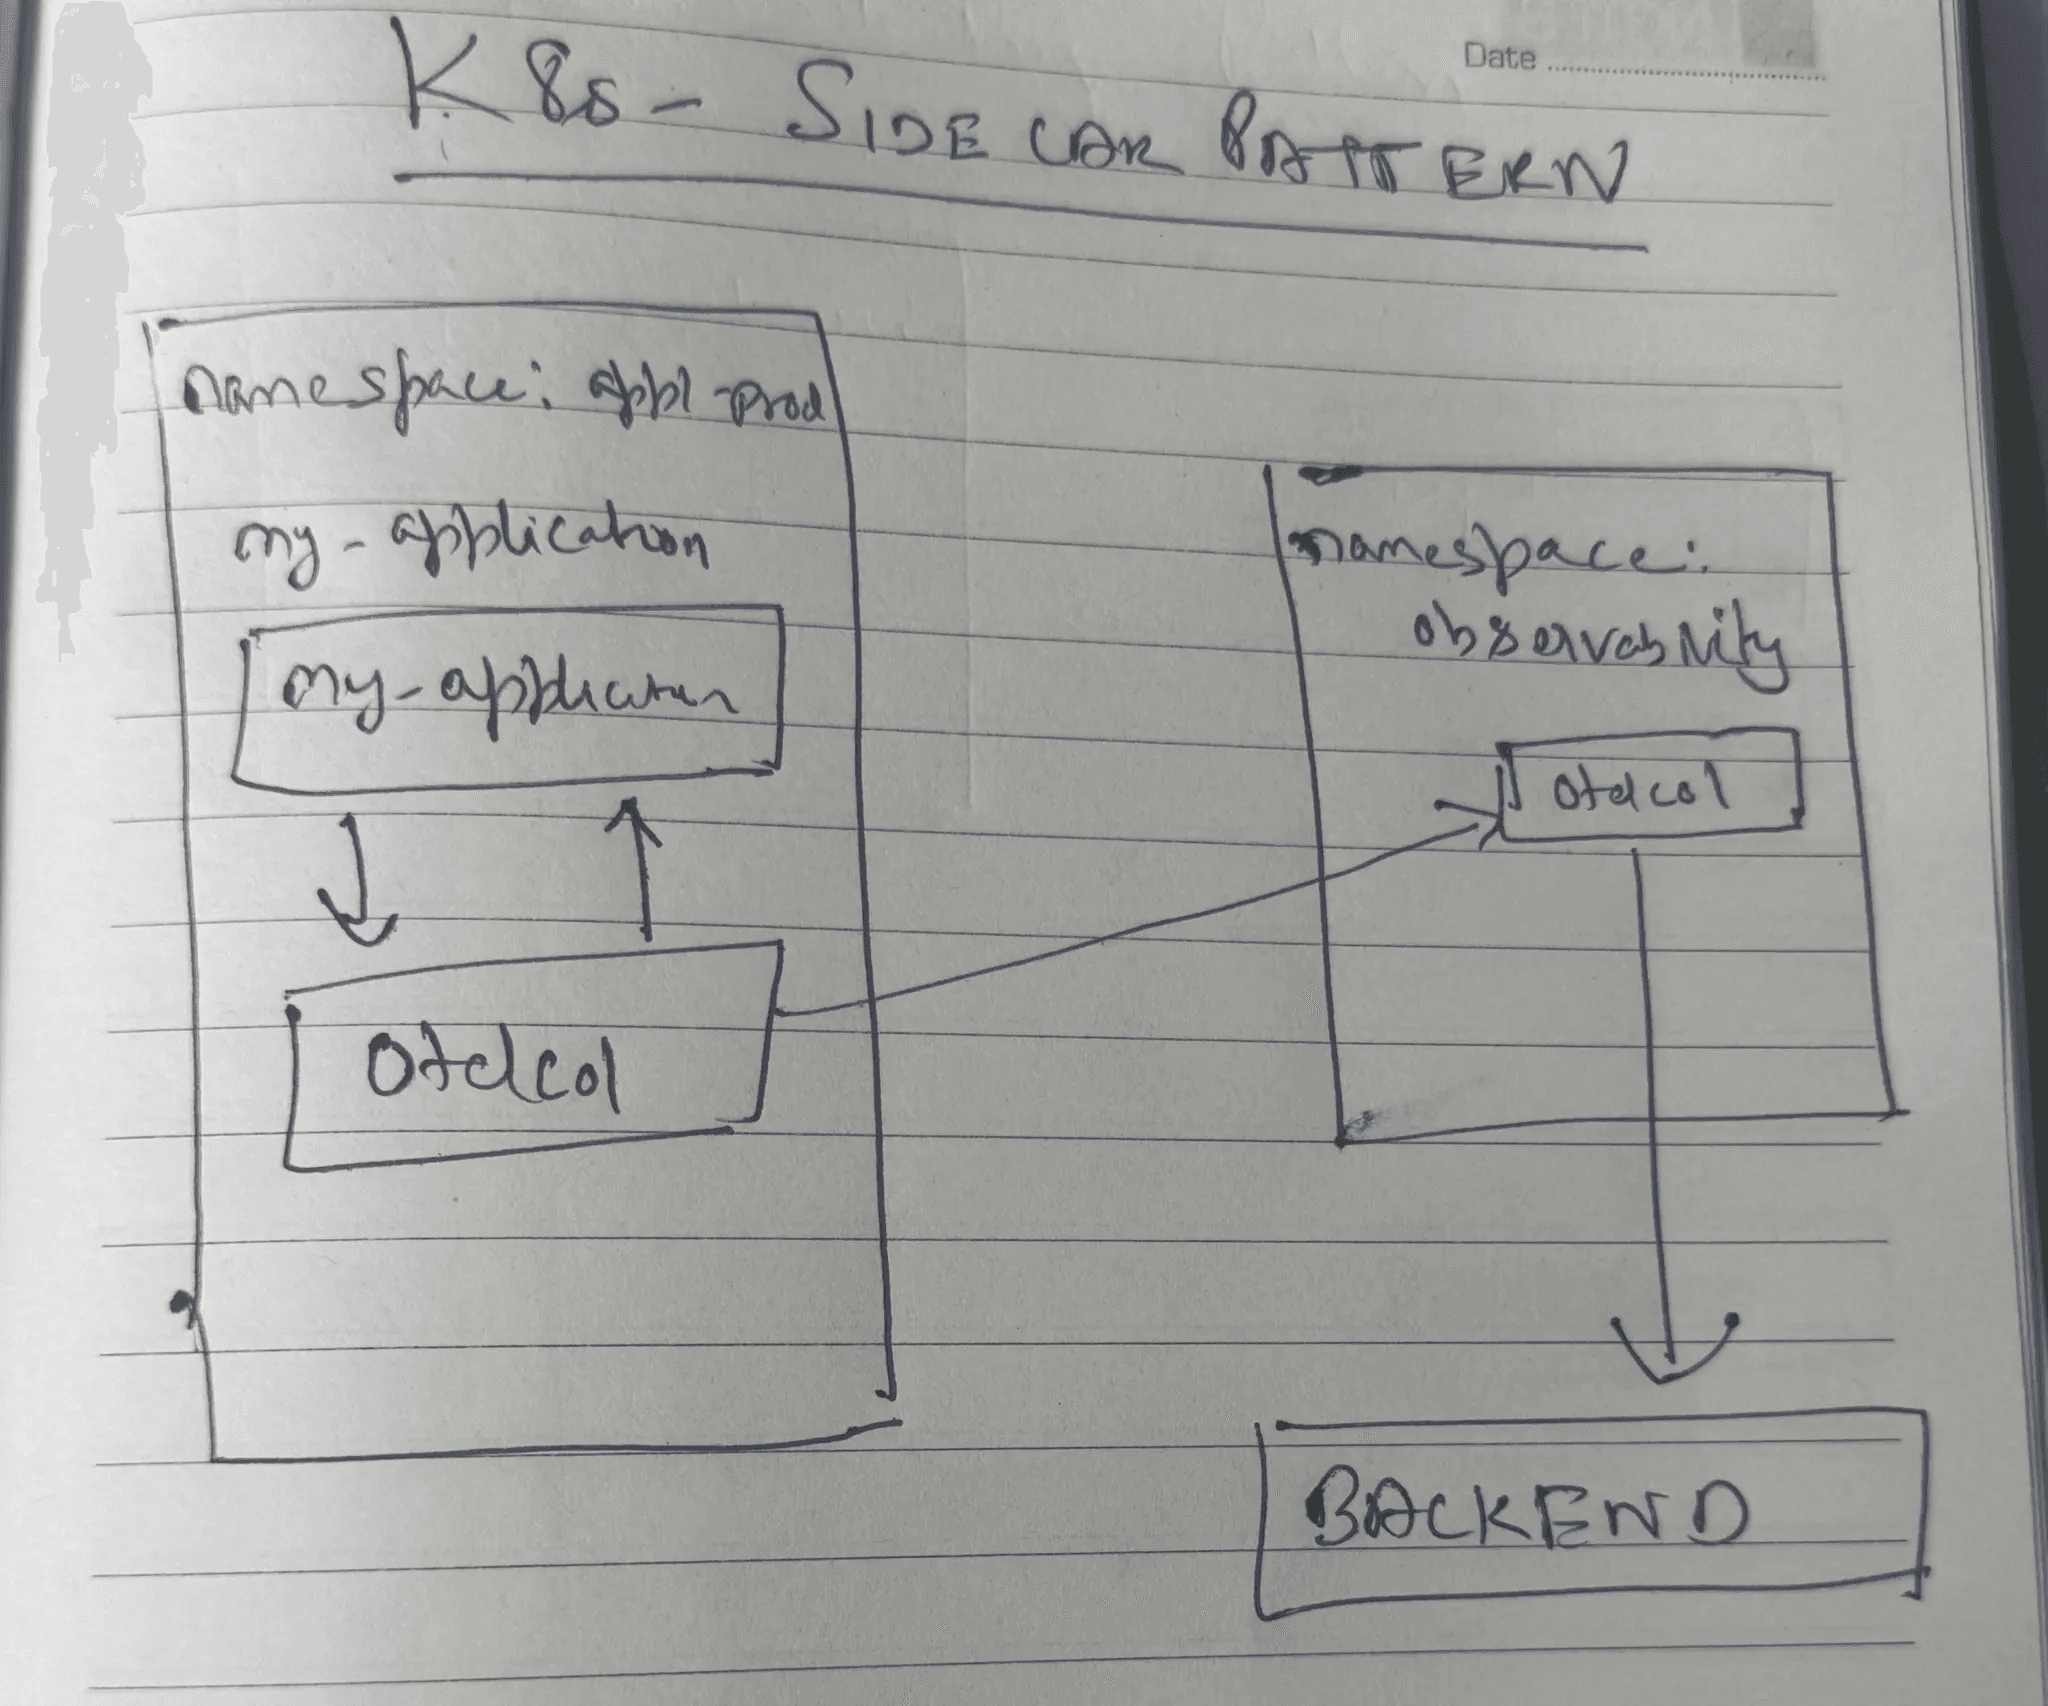
How it works:
The Collector is deployed as a sidecar alongside each application container in the same pod, giving you app-specific control.
Advantages:
Maximum isolation per app
Easily customizable configuration per service
Minimal latency (runs on localhost)
Trade-offs:
High resource consumption at scale
Managing/updating sidecars for every pod can get tricky
Best for:
Latency-sensitive apps; small to medium environments needing isolation.
4. Daemonset pattern
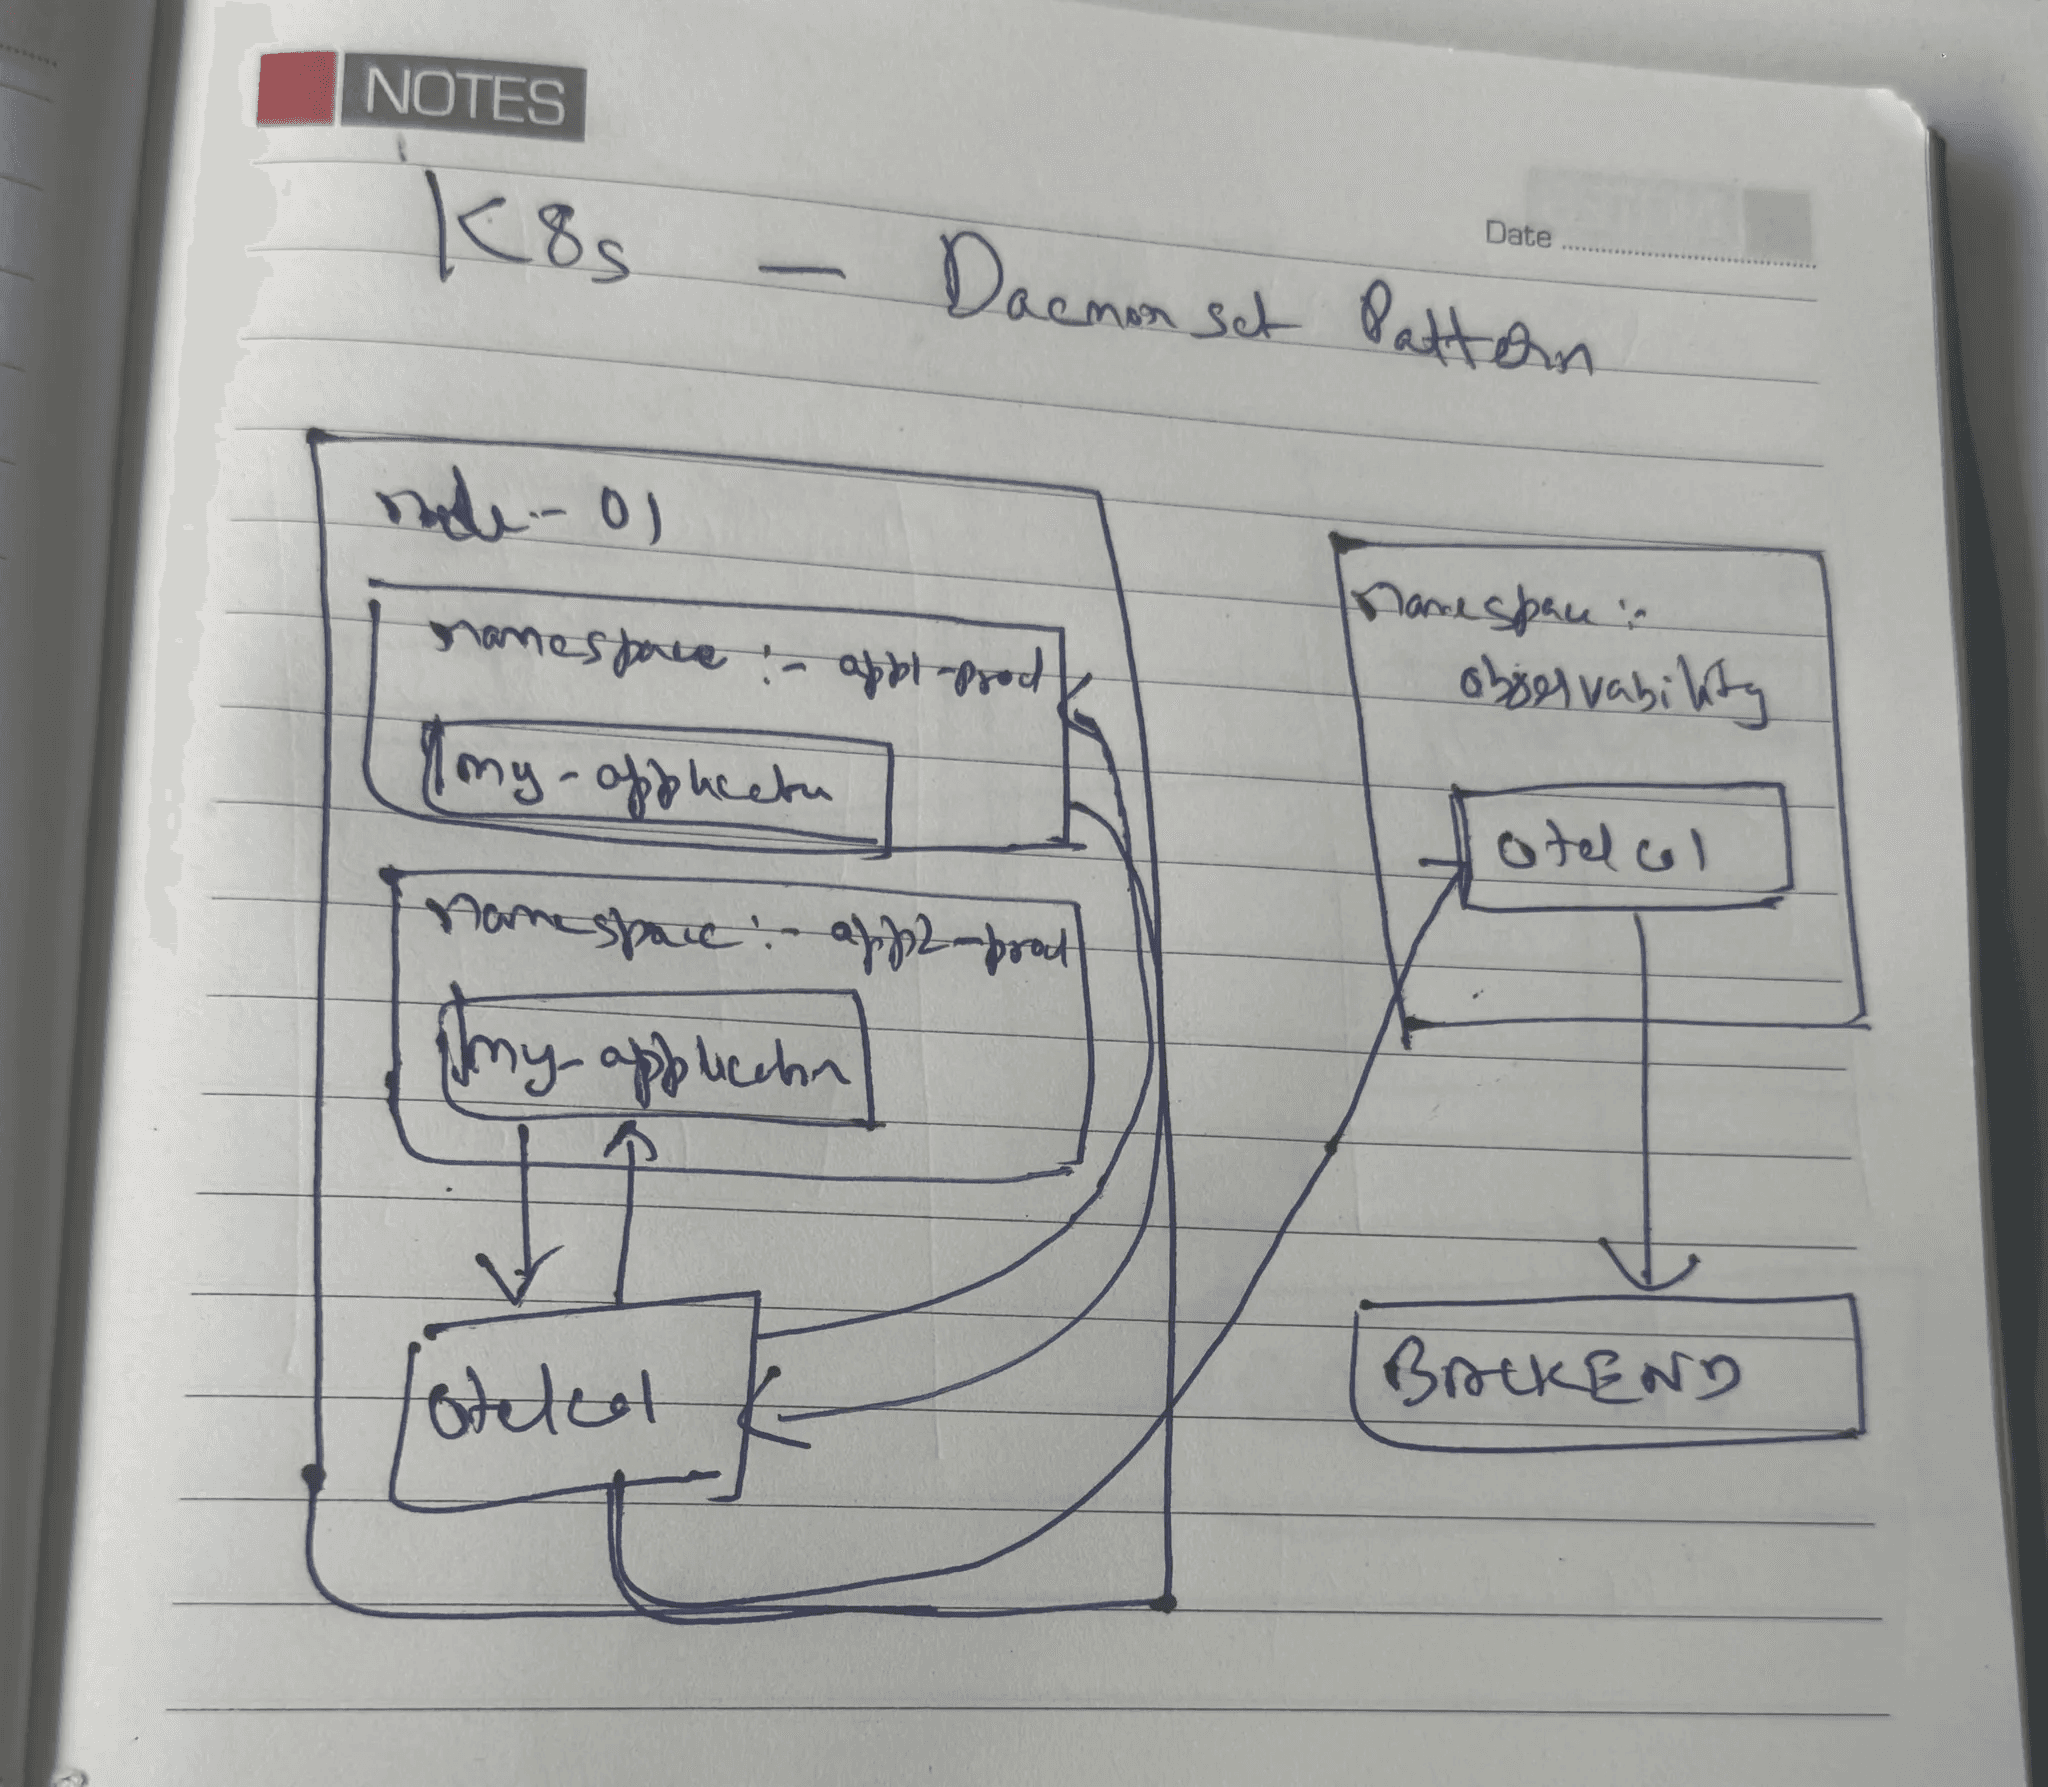
How it works:
Deploy one Collector pod per Kubernetes node (using a DaemonSet), allowing all local app pods to route telemetry through it.
Advantages:
Good balance of resource efficiency
Centralized Collector management and upgrades
Trade-offs:
Adds a network hop between app pod and Collector
Can become a bottleneck on busy nodes
Best for:
Large-scale clusters; situations where centralized management is more valuable than per-app isolation.
5. Init-container pattern
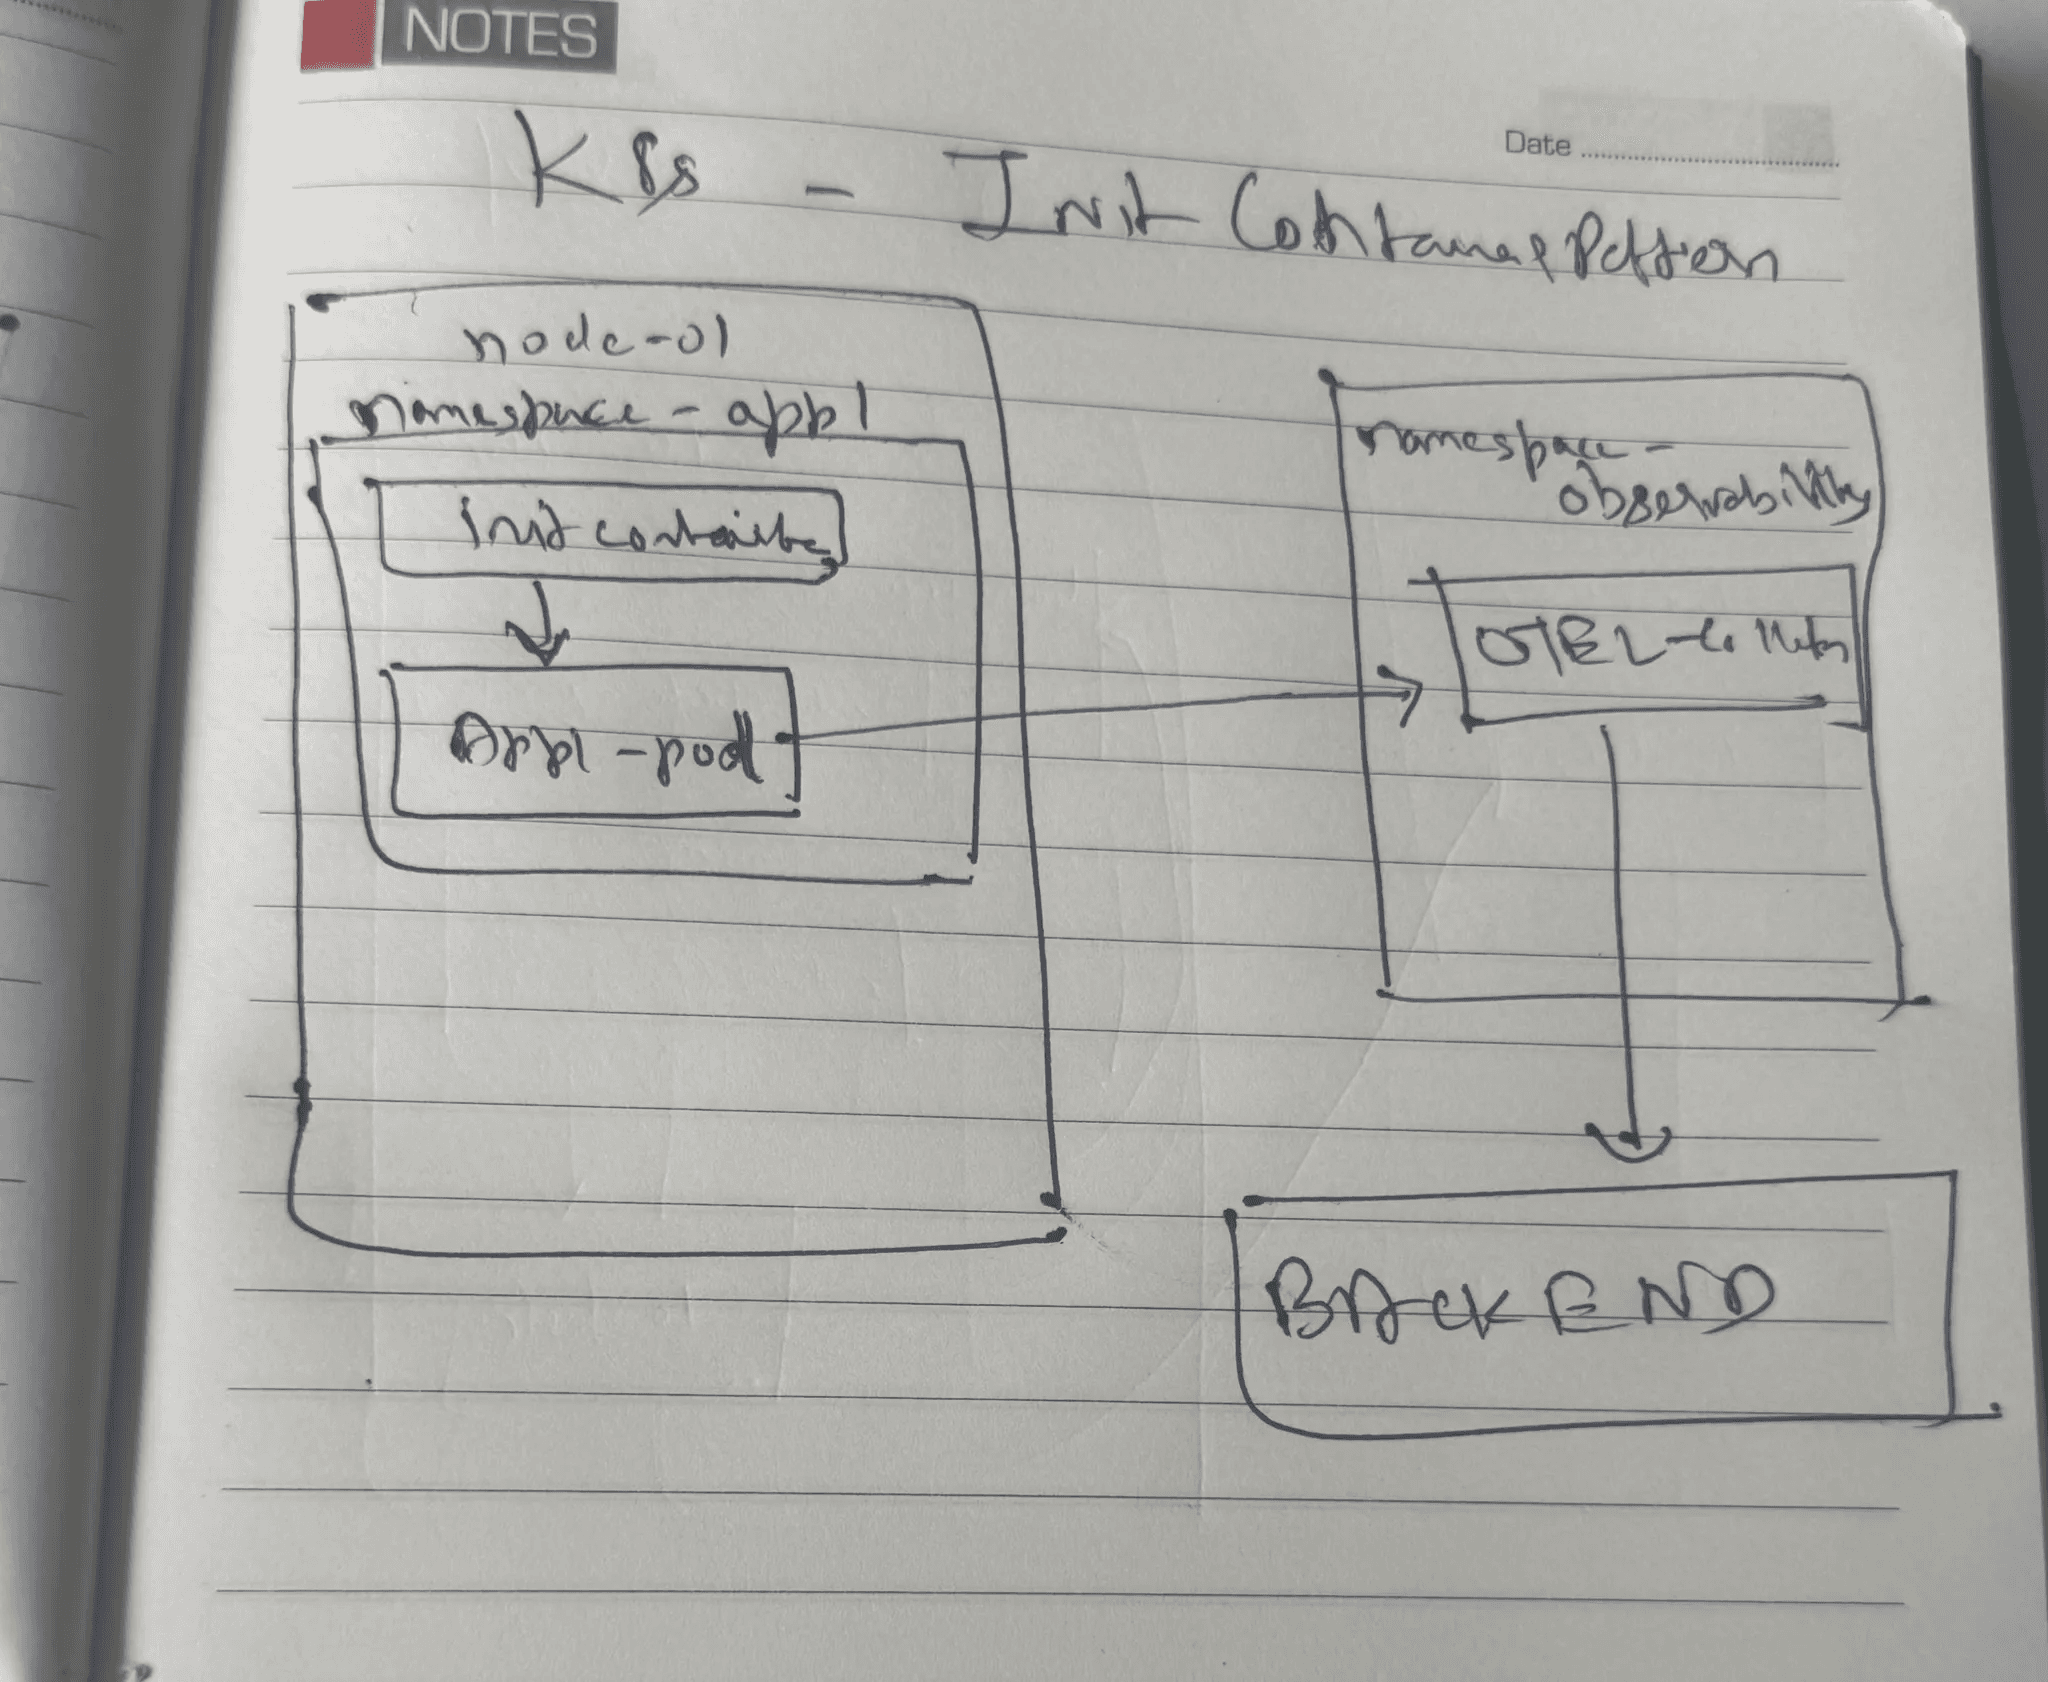
How it works:
A Collector runs only at pod startup (as an init-container), exporting telemetry just once before your main app runs.
Advantages:
No ongoing resource usage
Only runs when needed at startup
Trade-offs:
Captures only initialization telemetry, not during app runtime
Slightly increases pod startup time
Best for:
Batch jobs, short-lived workloads, or when startup telemetry is all you need.
Comparing deployment patterns
Here’s a quick summary table of the patterns, their ideal use cases, and major trade-offs:
# | Pattern name | Best for | Main trade-offs |
|---|---|---|---|
1 | No collector | Simplicity, minimal infrastructure | No data enrichment, tight backend coupling |
2 | Agent | Local enrichment, backend decoupling | Some added infra overhead |
3 | Sidecar | Low-latency, app-level configs, isolation | High overhead, many sidecars to manage |
4 | Daemonset | Large-scale, shared infrastructure, central config | Possible node bottlenecks, network hop |
5 | Init-container | Batch jobs, startup-only telemetry needs | No runtime data, increases startup latency |
Final thoughts
Choosing the right OpenTelemetry Collector deployment pattern is a foundational decision that impacts your observability strategy's success. The sidecar pattern offers maximum flexibility and isolation but at the cost of resource consumption. The DaemonSet pattern provides operational efficiency and resource optimization while potentially creating bottlenecks.
As your observability needs evolve, remember that these patterns aren't mutually exclusive. Mature organizations often employ multiple patterns simultaneously, using DaemonSet for most applications while deploying sidecars for services with unique requirements.
The key is starting with a pattern that matches your current operational capabilities and scaling needs, then evolving your approach as your team's expertise and requirements grow. With the right deployment foundation, OpenTelemetry transforms from a complex observability challenge into a powerful tool for understanding and optimizing your systems.
Still unsure about what suits your environment? We’ve helped organizations of all sizes evolve their observability stacks, and we can help you too. We specialize in building robust, maintainable observability solutions that grow with your business. Reach out to us to discuss your observability challenges.
As observability moves from a nice-to-have to a must-have, decisions about how you architect your telemetry pipeline can make or break your reliability. By now, if you’ve followed our Otel blog series, you already know the what, the why, and the nitty-gritty of OpenTelemetry. This part of your journey is all about answering a tough question: how should you actually run the OpenTelemetry Collector in your Kubernetes environment?
Why deployment patterns matter
Imagine you’re running a fast-growing web app. Every team says their stack is healthy, but customer complaints keep rolling in. Where do you start investigating? Only properly deployed observability unlocks real answers that is if your deployment pattern fits your needs.
The OpenTelemetry Collector acts as the core of your telemetry pipeline. How you deploy it shapes:
Resource efficiency: The wrong setup wastes CPU, memory, or network.
Scalability: Can your approach handle growth, or will telemetry lag behind?
Operational complexity: Some methods need a lot of manual work; others, almost none.
Let’s walk through the main deployment models and see what works best in practice.
1. No collector pattern
How it works:
Your application sends telemetry directly to your backend (like Prometheus or New Relic), skipping a Collector layer altogether.
Advantages:
Simplest possible setup
No collector to configure or manage
Trade-offs:
Hard to enrich or process data
Tightly couples your app to backend protocols and vendors
Best for:
Very simple use cases; backends that fully support your app’s telemetry format.
2. Agent pattern
How it works:
A Collector runs as a lightweight agent within each pod or node, handling telemetry before it leaves the environment.
Advantages:
Decouples applications from backend details
Enables local sampling, batching, or enrichment
Trade-offs:
Adds some compute overhead
Slightly more moving parts to maintain
Best for:
Pre-processing needs or when direct integration isn’t practical.
3. Sidecar pattern
How it works:
The Collector is deployed as a sidecar alongside each application container in the same pod, giving you app-specific control.
Advantages:
Maximum isolation per app
Easily customizable configuration per service
Minimal latency (runs on localhost)
Trade-offs:
High resource consumption at scale
Managing/updating sidecars for every pod can get tricky
Best for:
Latency-sensitive apps; small to medium environments needing isolation.
4. Daemonset pattern
How it works:
Deploy one Collector pod per Kubernetes node (using a DaemonSet), allowing all local app pods to route telemetry through it.
Advantages:
Good balance of resource efficiency
Centralized Collector management and upgrades
Trade-offs:
Adds a network hop between app pod and Collector
Can become a bottleneck on busy nodes
Best for:
Large-scale clusters; situations where centralized management is more valuable than per-app isolation.
5. Init-container pattern
How it works:
A Collector runs only at pod startup (as an init-container), exporting telemetry just once before your main app runs.
Advantages:
No ongoing resource usage
Only runs when needed at startup
Trade-offs:
Captures only initialization telemetry, not during app runtime
Slightly increases pod startup time
Best for:
Batch jobs, short-lived workloads, or when startup telemetry is all you need.
Comparing deployment patterns
Here’s a quick summary table of the patterns, their ideal use cases, and major trade-offs:
# | Pattern name | Best for | Main trade-offs |
|---|---|---|---|
1 | No collector | Simplicity, minimal infrastructure | No data enrichment, tight backend coupling |
2 | Agent | Local enrichment, backend decoupling | Some added infra overhead |
3 | Sidecar | Low-latency, app-level configs, isolation | High overhead, many sidecars to manage |
4 | Daemonset | Large-scale, shared infrastructure, central config | Possible node bottlenecks, network hop |
5 | Init-container | Batch jobs, startup-only telemetry needs | No runtime data, increases startup latency |
Final thoughts
Choosing the right OpenTelemetry Collector deployment pattern is a foundational decision that impacts your observability strategy's success. The sidecar pattern offers maximum flexibility and isolation but at the cost of resource consumption. The DaemonSet pattern provides operational efficiency and resource optimization while potentially creating bottlenecks.
As your observability needs evolve, remember that these patterns aren't mutually exclusive. Mature organizations often employ multiple patterns simultaneously, using DaemonSet for most applications while deploying sidecars for services with unique requirements.
The key is starting with a pattern that matches your current operational capabilities and scaling needs, then evolving your approach as your team's expertise and requirements grow. With the right deployment foundation, OpenTelemetry transforms from a complex observability challenge into a powerful tool for understanding and optimizing your systems.
Still unsure about what suits your environment? We’ve helped organizations of all sizes evolve their observability stacks, and we can help you too. We specialize in building robust, maintainable observability solutions that grow with your business. Reach out to us to discuss your observability challenges.