Over the past few months at One2N, we evaluated several AI SRE agents, ranging from open source to commercial, across incident investigations, alert triage, summarisation, and RCA workflows.
Some were useful. Others looked impressive in demos but were harder to operationalise. Some only showed their gaps in front of production systems.
Those tests became the baseline we use before we let any AI agent near a production incident.
Can we trust this AI SRE agent during incident triage, given the evidence and context it can access?
This post applies that bar to one open-source PoC: OpenSRE from TracerCloud, tested in a May to July 2026 PoC window on v0.1.
Short on time? Jump to the OpenSRE PoC scorecard →
The problem AI SRE agents need to solve: faster isolation
Most incidents are easy once you know where to look. The hard part is reducing time to isolate the fault, then preventing the same class of failure from recurring.
We track that internally as MTTI (mean time to isolate) and MTBF (mean time between failures). Isolation speed is where an AI SRE agent should earn its keep. While MTBF is usually preventative work after the page.
During an incident you are correlating logs, metrics, and traces, holding a timeline of recent changes in your head, and slowly building a mental map of a system you might not have designed. Eventually, that picture is enough to narrow the fault down. Most of the time it lives in the head of whoever has been on call the longest, and it walks out the door the day they leave.
Without access to the same evidence, the agent is often working with an incomplete picture which is not enough to shorten a real investigation.
Why this matters
I learned this the hard way. As a new engineer on my first on-call rotation, nervous because I barely knew the systems or the network topology yet, I got paged with: "Spark job failed inside prod-eks-XXX cluster." I spent 20–30 min tracing logs, deployment repos, Confluence pages, and old incidents before finding the cause: a persistent volume filled up, preventing Spark jobs from writing to storage.
I went to bump the PVC storage request, but it wouldn't expand: the StorageClass had allowVolumeExpansion: false. After confirming the CSI driver and volume supported expansion, we enabled allowVolumeExpansion, increased the PVC request, and verified the resize.
This was a one or two-line fix, buried behind systems I didn't know yet. That is the class of problem an AI SRE agent should compress. It is also why we do not adopt on demo vibes alone.
The types of AI SRE agents: incident response vs full production coverage
Not every tool that markets itself as "AI SRE" solves the same problem. So before we score a product, we place it in one of two camps.
Incident-focused tools which sit on the on-call loop.
They help diagnose the alert, draft the update, and support the postmortem.
Their primary focus is incident investigation and response; code-change analysis, cost optimisation, and ongoing service-topology learning are typically outside that core workflow.
In practice they are usually an AI layer on top of an incident or observability platform you already run, via MCP or tool calling.
Examples: OpenSRE (TracerCloud), Cleric, Parity, and the AI layers inside incident.io, Rootly, and PagerDuty.
Broader production-operations platforms watch more of the lifecycle of running production.
They look at health, deployments, scaling patterns, and sometimes Slack threads.
They tie that context back to alerts.
Between incidents they look for drift, usage trends, and waste.
When something breaks, they are not starting cold.
Examples: Resolve.ai, Datadog Bits AI SRE, Dynatrace Davis AI, Causely.
This evaluation focuses on incident-focused tools. If a product in that camp grows into a broader platform, even better. An agent that already knows what changed still beats one that wakes cold with the on-call engineer and has to build context from scratch.
How we evaluate AI SRE agents
During an incident, I care about three things: can I trust the investigation, can I trust the recommended actions (human-in-the-loop or autonomous), and can the agent stay inside the security lines we drew.
I would not give any AI SRE agent free rein to run arbitrary queries on a production database. If it pulls sensitive data and ships it outside the trust boundary without controls, that is a compliance incident with a chat UI waiting to happen.
So we score agents on five dimensions. Cost and wall-clock time matter, but they measure efficiency. These five measure if I would actually lean on the tool during an incident:
Actionability and control safety: Can it take or propose action when something breaks? Direct action may be fine in lower environments. Production needs stronger controls, especially across restricted networks and sensitive systems.
RCA quality: RCAs should be backed by evidence gathered while forming the hypothesis, not filled in with guesswork. LLM output is non-deterministic, so there'll always be edge cases, but the tool should say clearly when it didn't have enough information to form one.
Observability integrations and correlation: The agent needs access to the same evidence paths as an on-call engineer: telemetry, cloud and Kubernetes context, deployment history, and team knowledge. It must also surface failed or incomplete integrations. A confident answer on missing evidence is worse than no answer. This is why we care about homogeneous observability and reading SRE graphs carefully.
Incident memory, runbooks, and operational knowledge: If every similar page is a cold start, you are paying latency and tokens instead of compounding what the team already knows. Runbooks, incident history, and tribal knowledge should be retrievable when relevant.
Security: Can actions be gated? Can it run air-gapped or tightly controlled? Does it respect data handling rules before anything leaves the trust boundary?
Running OpenSRE through the evaluation criteria
When we tested it, OpenSRE was mainly a CLI on a laptop or a server inside the network. Its roadmap pointed toward becoming a full production-coverage platform, but it wasn't there yet, so we scored it based on its current capabilities.
Reference: OpenSRE v0.1. Demo of the backend-down run: 6-minute walkthrough.
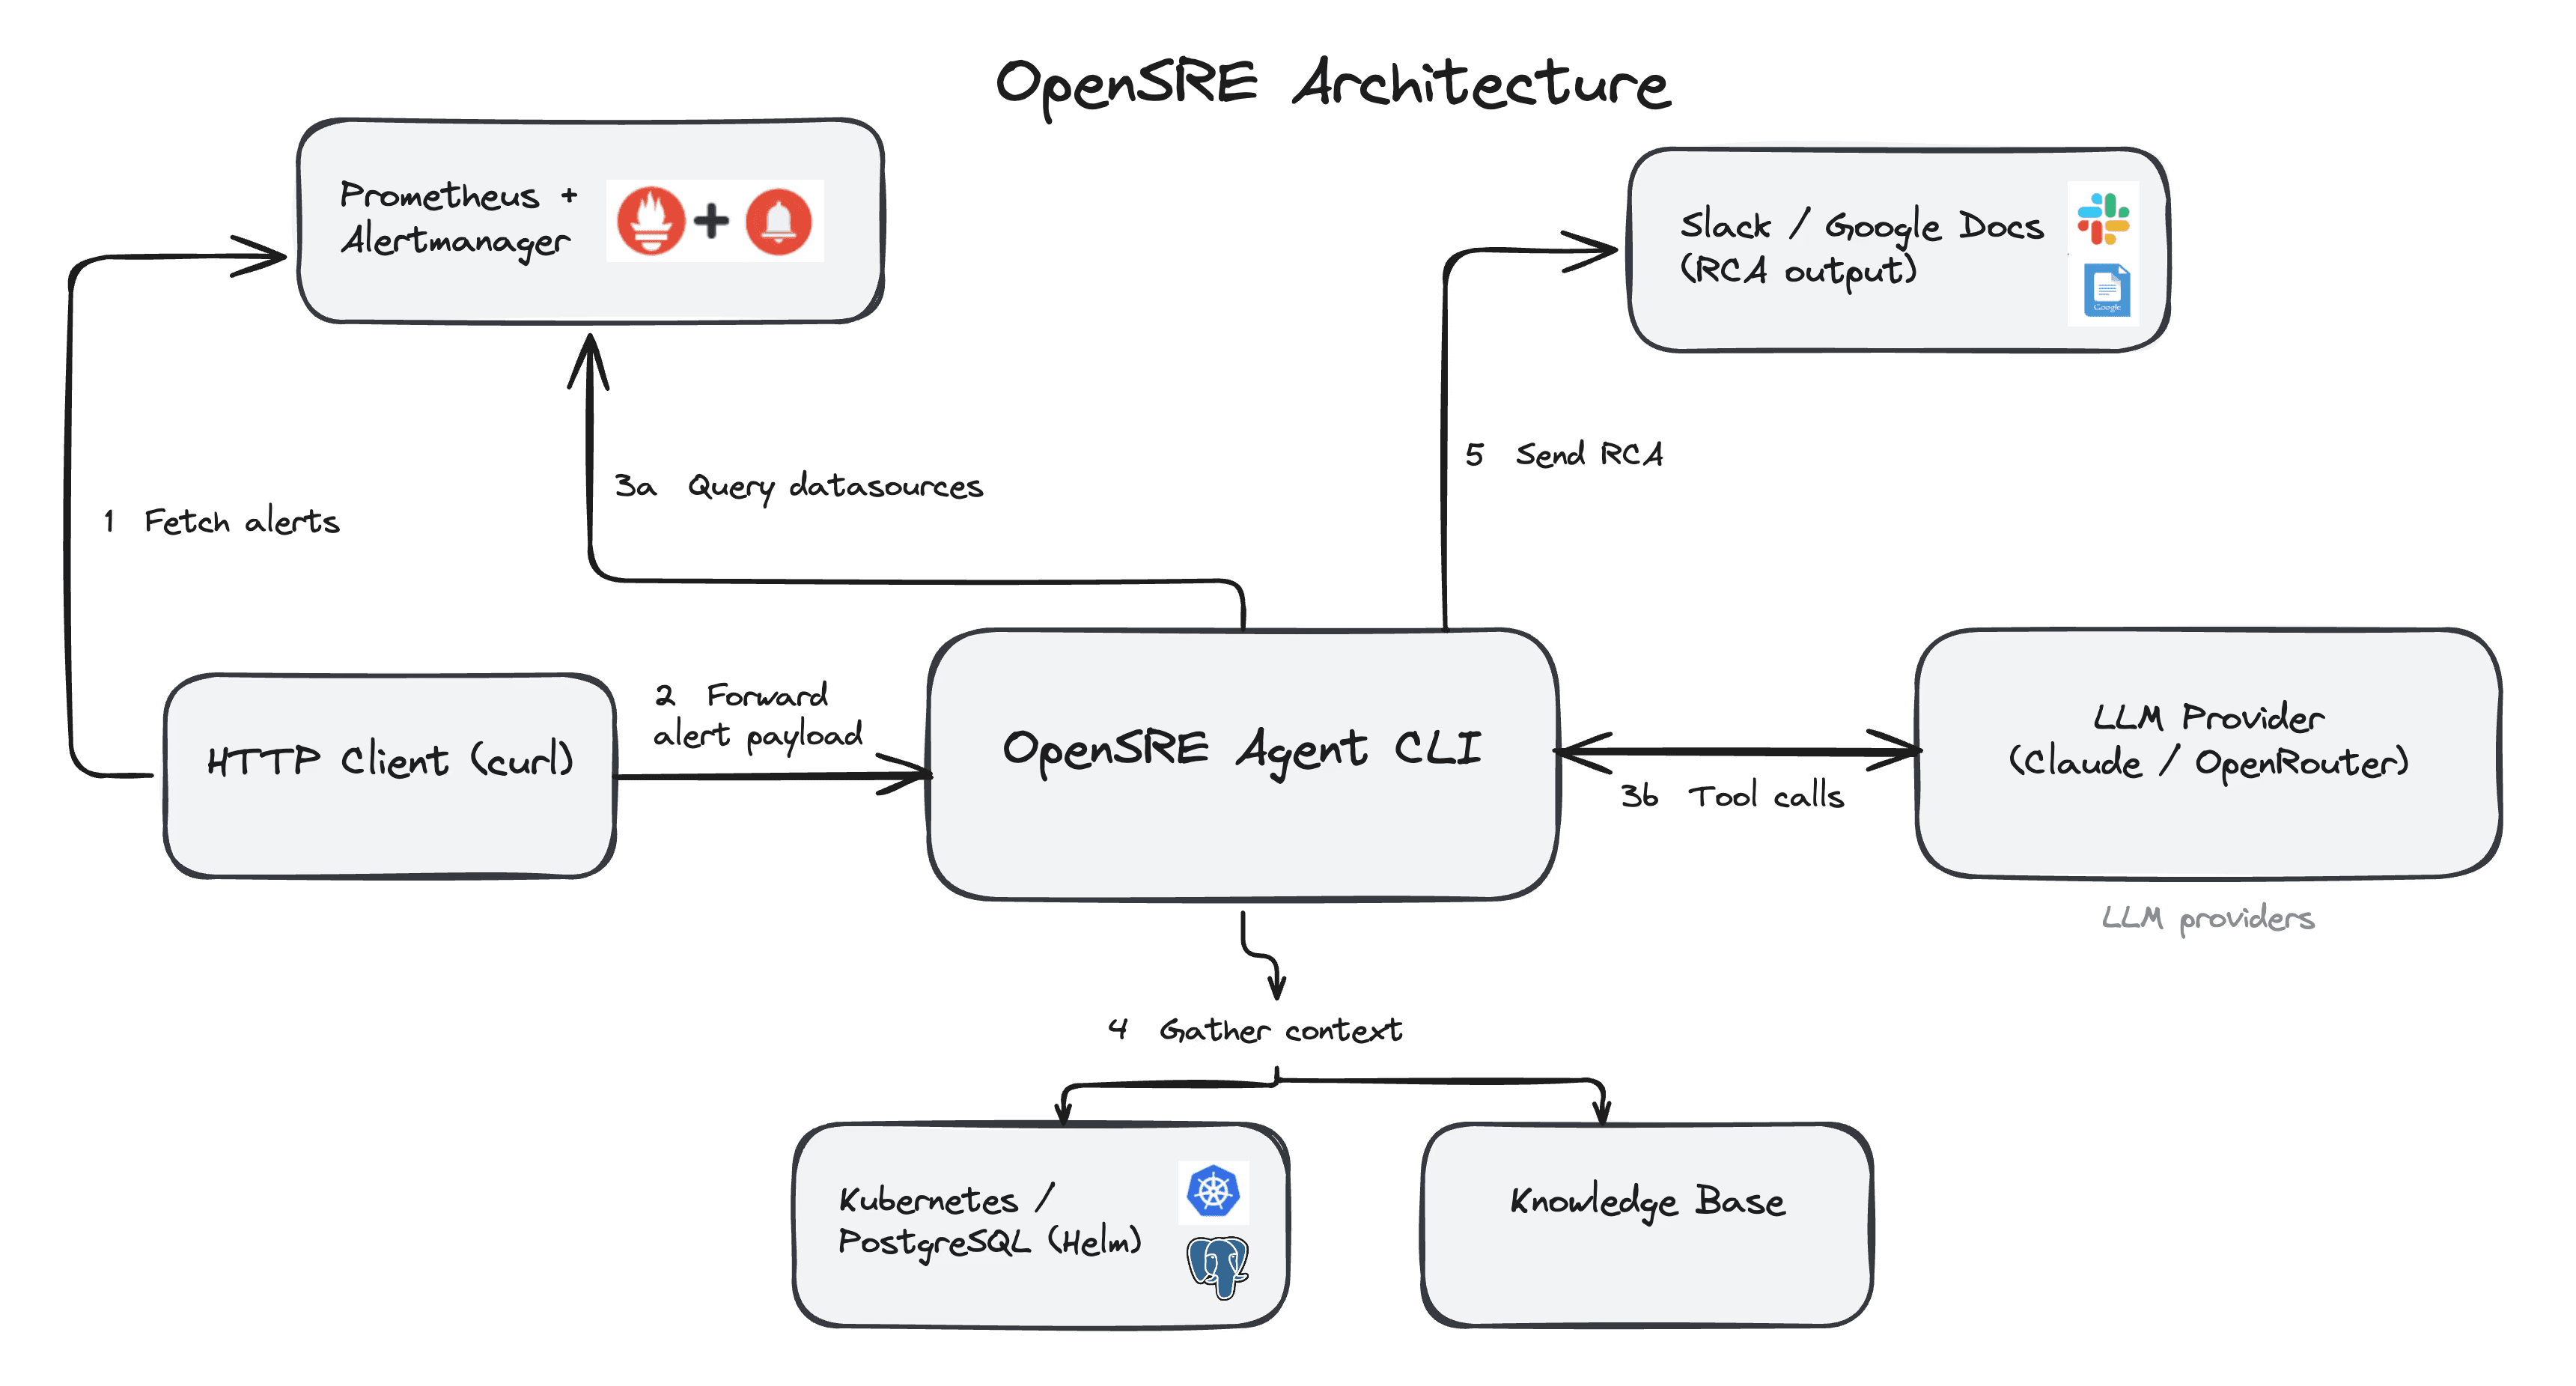
Fig 1: OpenSRE architecture under evaluation.
Alerts enter via Alertmanager into the CLI; the agent queries datasources, calls an LLM, gathers context, and can send RCA output to Slack or Google Docs.
Test environment
I did not want a single-service hello-world. I wanted something closer to a customer estate: an app tier plus the observability path an on-call engineer would actually touch.
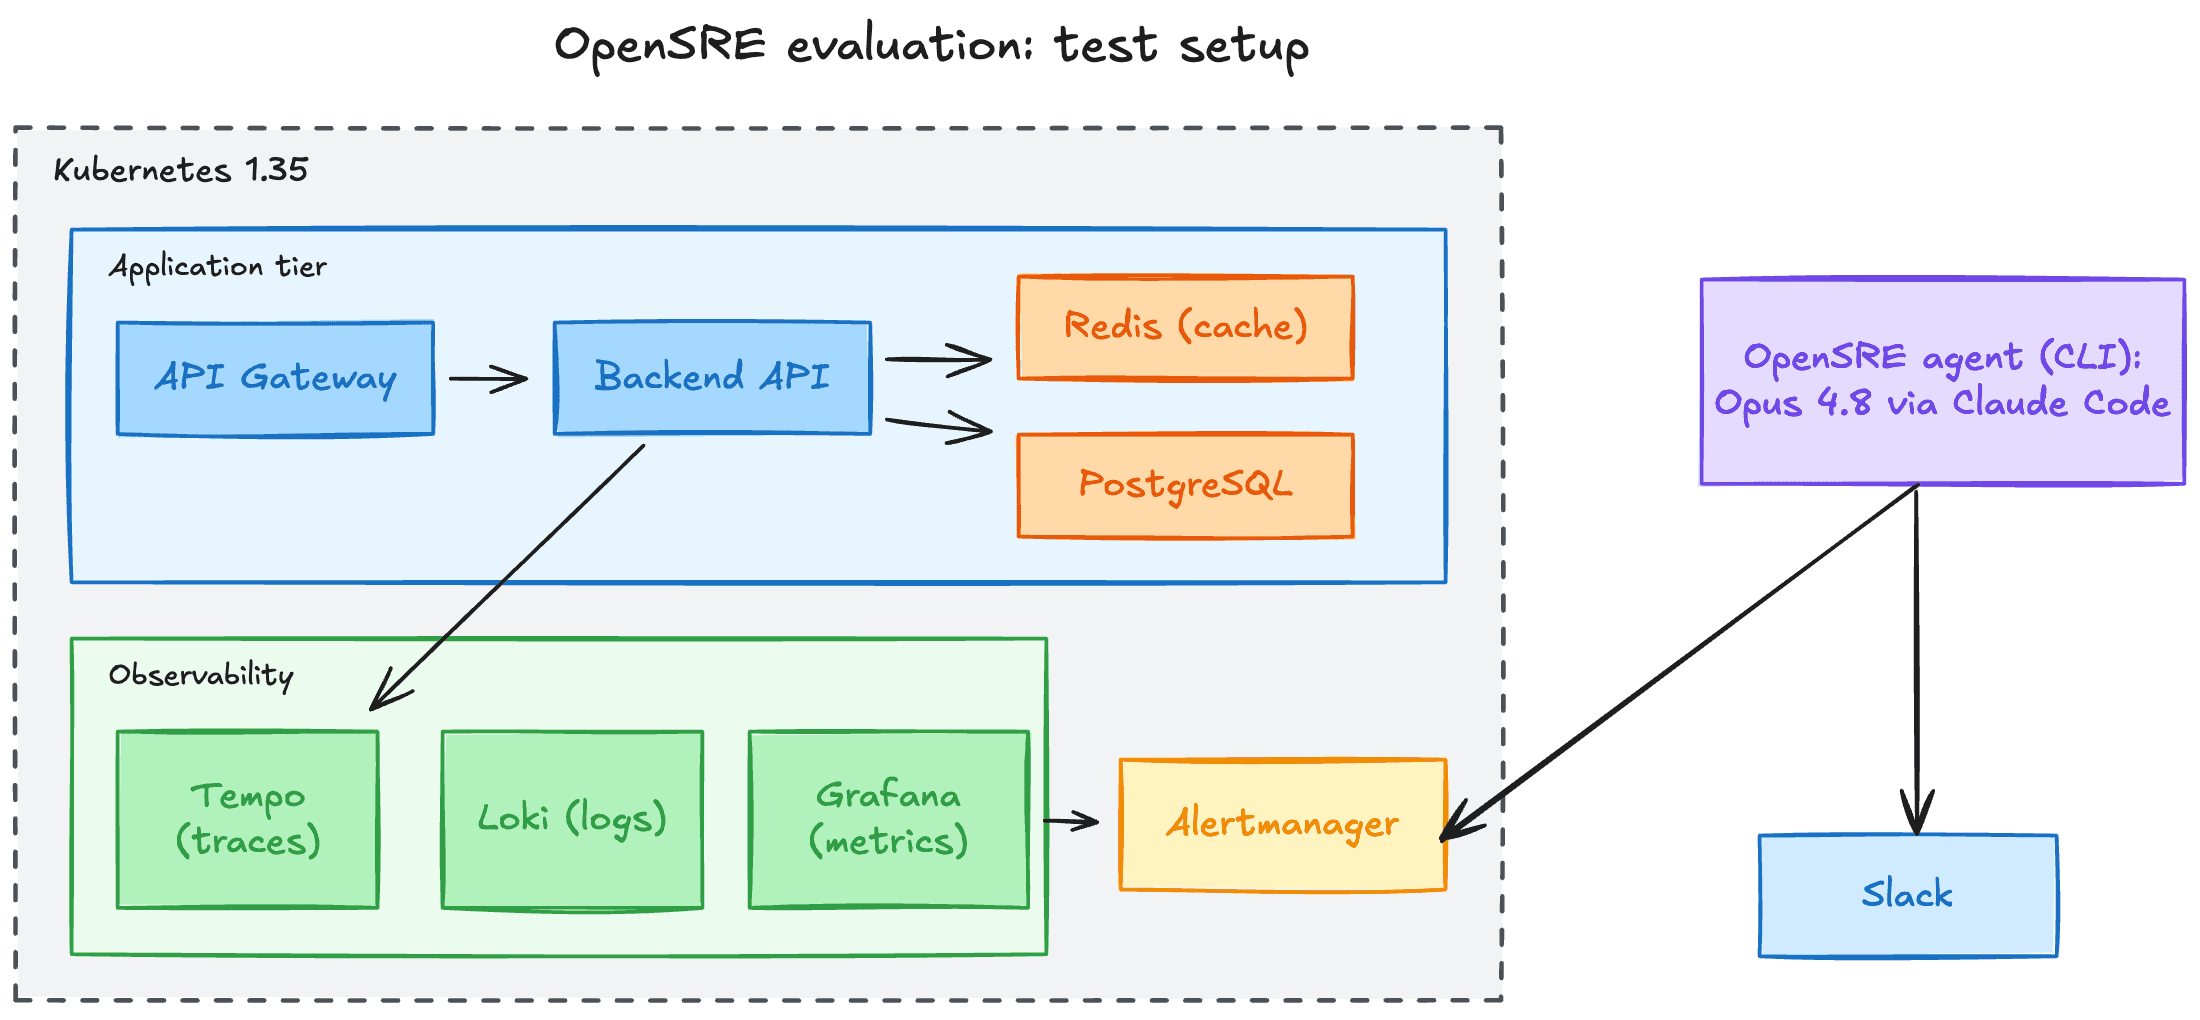
Fig 2: Kubernetes test stack for evaluating OpenSRE.
Platform: Docker Desktop with Kubernetes v1.35 enabled
Application tier: an API gateway fronting a backend API, with Redis as the cache and PostgreSQL as the primary datastore
Alerting: Alertmanager, used as the intended incident-signal source in our tested workflow
Observability: Grafana for metrics and dashboards, Loki for logs, and Tempo for distributed traces
AI model / OpenSRE version: OpenSRE v0.1 at commit
3c71f2fd2904, Claude Opus 4.8 via Claude Code, May to July 2026 PoC window (~6 hours end to end for stack, chaos, and investigate loops)
The reproduction kit lives at one2nc/ai_sre (OpenSRE): it contains observability stack, chaos targets, alert fixtures, and the investigate wrapper we used.
You can run it yourself if you want:
git clone https://github.com/one2nc/ai_sre.git && cd ai_sre/opensre
make env && make install && opensre onboard
make stack-up && make port-forward   # Grafana :3000, Alertmanager :9093
make chaos-postgres-down && sleep 60 && make investigate-stdin
make chaos-full-run walks postgres → redis → backend → gateway → all-down, with investigate + reset between each scenario. Scenario notes and screenshots are in the repo opensre/README.md.
The failure modes I put it through
I picked three failures any on-call engineer on a microservices stack would recognise, and triggered them with kubectl: mostly scaling things to zero, plus a CrashLoopBackOff. The make targets in the repo are just how I repeated the same mess cleanly.
PostgreSQL down: the primary database goes away, so every dependent service fails with it.
make chaos-postgres-downfiresAppPostgresDown.Backend down: the API tier goes offline, so the frontend and dependents start alerting.
make chaos-backend-downfiresAppBackendDown. I also ran a crashloop path (make chaos-backend-crashloop) that firesAppPodCrashLoopingalongside it.Redis down: the cache drops out, pushing latency and extra load onto Postgres.
make chaos-redis-downfiresAppRedisDown.
I ran each as a single alert and as part of a multi-alert burst. The all-services-down step in make chaos-full-run is the noisy version. From here on, "all three failure modes" refers to these.
Single alerts are where demos look good. Alert storms are where I decide whether something belongs in front of on-call.
Each dimension gets one of three marks:
(1) Meets the bar: sufficient for this dimension in the tested scenario.
(0) Partially meets: useful capability, but a material gap remains.
(-1) Does not meet: a gap blocks use for the tested scenario.
Actionability and control safety
Slack delivery worked. I triggered a failure, waited, and the summary landed in the channel. For a tool that does not remediate yet, staying read-only is the right call. It did not need cluster write permissions. I liked that.
What was missing was control over what it could read. I could not enforce a rule such as “never query Kubernetes Secrets or databases.” There was also no approval step before it sent a summary or fetched more context from connected systems.
That may be fine in a lower environment. I would not put it next to production credentials.
Eval: Partially meets (0)
Root cause analysis: accuracy and evidence
This is where the polished Slack update stopped being reassuring. I knew what I had broken, but the write-up still sounded confident about a different cause.
Across all three failure modes, the agent kept proposing causes it could not support with evidence. In one case, I had scaled replicas to zero with
kubectlor caused a CrashLoopBackOff. The agent suggested a Helm rollback, even though no rollback had happened.It did label the result “Inferred (not yet validated).” That is better than presenting it as fact. Still, I would not trust the output during an incident. If the agent cannot verify a cause, it should say what evidence is missing instead of filling the gap with a likely-sounding explanation.
Most of the time, it produced an alert summary for Slack rather than an RCA against a useful template.
Eval: Does not meet (-1)
Integrations and incident correlation
This decided the PoC for me. I ran both single-alert and multi-alert scenarios, and none of the outputs were something I would hand to an on-call engineer.
Three things kept showing up:
Alert ingestion was manual. In our test path, Alertmanager did not feed OpenSRE directly.
/api/v2/alertsreturns a JSON array, whileopensre investigate -i -expects webhook JSON with an"alerts"key. We addedmake investigate-stdinto convert the payload. That still meant fetching the alert and passing it to OpenSRE myself.It did not treat an alert burst as one incident. OpenSRE processed one alert per run and selected the first alert in sort order. There was no grouping or correlation. The only workaround was to loop through the remaining alerts manually.
Cluster context was tied to Helm. The tested workflow did not use Kubernetes API access. Workloads deployed with Kustomize or plain manifests were therefore outside the context the tool could retrieve. Helm is common, but it is rarely the only deployment method in a real environment.
Some integrations also failed during the PoC: Grafana returned 401, the binary install missed psycopg2, and Helm verification/setup did not work. We filed them upstream: #2500 (Grafana 401), #2459 (psycopg2, later fixed), #1973 (Helm, re-opened).
The issue was not that the tool crashed. It was that it could still return an answer after part of the evidence path had failed.
Eval: Does not meet (-1)
Service knowledge graph and context memory
I looked for the places where operational knowledge usually lives: Google Docs or Notion runbooks, similar past incidents, and Slack threads where someone had already solved the same problem.
In the v0.1 workflow we tested, I could not find or validate retrieval from any of them.
That means every similar page is a coldstart. A useful incident agent should be able to say: “We have seen this before. Here is the runbook, the previous RCA, and what worked last time.”
Eval: Does not meet (-1)
Security
Read-only by default is the right starting posture. The project describes guardrails that should detect credentials and mask them before data reaches the LLM.
In the CLI workflow we tested, I could not verify that masking worked end to end. For a regulated environment, that is enough to keep the tool away from production data until the path is proven.
This was not a penetration test or a formal data-flow review. It reflects only what we could observe in the workflow we ran.
Eval: Partially meets (0)
Scorecard for this PoC
Mapped back to the five dimensions, here is where OpenSRE landed in this PoC:
Dimension | Score | Why |
|---|---|---|
Actionability | (0) Partially meets | Slack delivery and read-only default are right; no gated remediation or approval path |
RCA quality | (-1) Does not meet | Unsupported causes; weak evidence trail; summarises more than it proves |
Integrations and correlation | (-1) Does not meet | Manual alert handoff; no multi-alert grouping; weak non-Helm Kubernetes context in our config |
Knowledge and memory | (-1) Does not meet | No validated runbooks, incident history, or chat retrieval in the tested workflow |
Security | (0) Partially meets | Read-only by design; sensitive-data masking was not validated end to end in the tested CLI workflow. |
Total | (-3) |
Is OpenSRE ready for production?
The intent behind OpenSRE is right, and starting read-only is the posture I want from an early agent. The path we tested is not one I would lean on during a real page. That, however, is not a permanent judgment on the project. Close the integration, correlation, and knowledge gaps, and the same failure matrix can be re-run honestly.
Where I landed for this PoC: defer, not reject.
Defer because the intent is worth another look. Not reject, and not adopt. Revisit once Alertmanager ingestion, multi-alert correlation, non-Helm Kubernetes context, and knowledge retrieval are mature enough to retest.
Before you adopt an AI SRE agent
Do not buy the demo. Put the agent under conditions that resemble real production. Insist on:
Single-alert and multi-alert scenarios. Do not stop at the clean demo path.
At least one broken or partial integration, to see whether the agent admits the gap or invents a cause.
Workloads that are not deployed the "happy" way in the vendor docs (plain
kubectl, Kustomize, mixed Helm).An explicit deny list for Secrets, databases, and other sensitive resources before any write path is enabled.
A templated RCA with evidence links. "Inferred" without recoverable proof fails the bar.
A check on whether the second similar incident is faster than the first. If the same incident starts from scratch every time, the tool is mostly summarising.
Happy-path demos will not tell you whether you can trust the agent at 1 AM. Honest evaluation needs noise, incomplete context, and partial failure of the surrounding platform.
Next up in this series: the same five dimensions against HolmesGPT, and a very different answer to what "AI SRE agent" means when you point it at a broken cluster.
At One2N we use the same production-first lens when helping teams adopt AI around reliability work.
An AI SRE agent is only as useful as the environment around it. It needs reliable telemetry, service context, and clear access boundaries before it can help during a real incident. That is the same foundation we build for AI Engineering and Site Reliability Engineering engagements.
Questions or pushback, reach me at hemant.kumar@one2n.in.
For more context from our team, check out: AI in SRE, AI-enabled SRE practices, and LLMs for incident response.
Over the past few months at One2N, we evaluated several AI SRE agents, ranging from open source to commercial, across incident investigations, alert triage, summarisation, and RCA workflows.
Some were useful. Others looked impressive in demos but were harder to operationalise. Some only showed their gaps in front of production systems.
Those tests became the baseline we use before we let any AI agent near a production incident.
Can we trust this AI SRE agent during incident triage, given the evidence and context it can access?
This post applies that bar to one open-source PoC: OpenSRE from TracerCloud, tested in a May to July 2026 PoC window on v0.1.
Short on time? Jump to the OpenSRE PoC scorecard →
The problem AI SRE agents need to solve: faster isolation
Most incidents are easy once you know where to look. The hard part is reducing time to isolate the fault, then preventing the same class of failure from recurring.
We track that internally as MTTI (mean time to isolate) and MTBF (mean time between failures). Isolation speed is where an AI SRE agent should earn its keep. While MTBF is usually preventative work after the page.
During an incident you are correlating logs, metrics, and traces, holding a timeline of recent changes in your head, and slowly building a mental map of a system you might not have designed. Eventually, that picture is enough to narrow the fault down. Most of the time it lives in the head of whoever has been on call the longest, and it walks out the door the day they leave.
Without access to the same evidence, the agent is often working with an incomplete picture which is not enough to shorten a real investigation.
Why this matters
I learned this the hard way. As a new engineer on my first on-call rotation, nervous because I barely knew the systems or the network topology yet, I got paged with: "Spark job failed inside prod-eks-XXX cluster." I spent 20–30 min tracing logs, deployment repos, Confluence pages, and old incidents before finding the cause: a persistent volume filled up, preventing Spark jobs from writing to storage.
I went to bump the PVC storage request, but it wouldn't expand: the StorageClass had allowVolumeExpansion: false. After confirming the CSI driver and volume supported expansion, we enabled allowVolumeExpansion, increased the PVC request, and verified the resize.
This was a one or two-line fix, buried behind systems I didn't know yet. That is the class of problem an AI SRE agent should compress. It is also why we do not adopt on demo vibes alone.
The types of AI SRE agents: incident response vs full production coverage
Not every tool that markets itself as "AI SRE" solves the same problem. So before we score a product, we place it in one of two camps.
Incident-focused tools which sit on the on-call loop.
They help diagnose the alert, draft the update, and support the postmortem.
Their primary focus is incident investigation and response; code-change analysis, cost optimisation, and ongoing service-topology learning are typically outside that core workflow.
In practice they are usually an AI layer on top of an incident or observability platform you already run, via MCP or tool calling.
Examples: OpenSRE (TracerCloud), Cleric, Parity, and the AI layers inside incident.io, Rootly, and PagerDuty.
Broader production-operations platforms watch more of the lifecycle of running production.
They look at health, deployments, scaling patterns, and sometimes Slack threads.
They tie that context back to alerts.
Between incidents they look for drift, usage trends, and waste.
When something breaks, they are not starting cold.
Examples: Resolve.ai, Datadog Bits AI SRE, Dynatrace Davis AI, Causely.
This evaluation focuses on incident-focused tools. If a product in that camp grows into a broader platform, even better. An agent that already knows what changed still beats one that wakes cold with the on-call engineer and has to build context from scratch.
How we evaluate AI SRE agents
During an incident, I care about three things: can I trust the investigation, can I trust the recommended actions (human-in-the-loop or autonomous), and can the agent stay inside the security lines we drew.
I would not give any AI SRE agent free rein to run arbitrary queries on a production database. If it pulls sensitive data and ships it outside the trust boundary without controls, that is a compliance incident with a chat UI waiting to happen.
So we score agents on five dimensions. Cost and wall-clock time matter, but they measure efficiency. These five measure if I would actually lean on the tool during an incident:
Actionability and control safety: Can it take or propose action when something breaks? Direct action may be fine in lower environments. Production needs stronger controls, especially across restricted networks and sensitive systems.
RCA quality: RCAs should be backed by evidence gathered while forming the hypothesis, not filled in with guesswork. LLM output is non-deterministic, so there'll always be edge cases, but the tool should say clearly when it didn't have enough information to form one.
Observability integrations and correlation: The agent needs access to the same evidence paths as an on-call engineer: telemetry, cloud and Kubernetes context, deployment history, and team knowledge. It must also surface failed or incomplete integrations. A confident answer on missing evidence is worse than no answer. This is why we care about homogeneous observability and reading SRE graphs carefully.
Incident memory, runbooks, and operational knowledge: If every similar page is a cold start, you are paying latency and tokens instead of compounding what the team already knows. Runbooks, incident history, and tribal knowledge should be retrievable when relevant.
Security: Can actions be gated? Can it run air-gapped or tightly controlled? Does it respect data handling rules before anything leaves the trust boundary?
Running OpenSRE through the evaluation criteria
When we tested it, OpenSRE was mainly a CLI on a laptop or a server inside the network. Its roadmap pointed toward becoming a full production-coverage platform, but it wasn't there yet, so we scored it based on its current capabilities.
Reference: OpenSRE v0.1. Demo of the backend-down run: 6-minute walkthrough.
Fig 1: OpenSRE architecture under evaluation.
Alerts enter via Alertmanager into the CLI; the agent queries datasources, calls an LLM, gathers context, and can send RCA output to Slack or Google Docs.
Test environment
I did not want a single-service hello-world. I wanted something closer to a customer estate: an app tier plus the observability path an on-call engineer would actually touch.
Fig 2: Kubernetes test stack for evaluating OpenSRE.
Platform: Docker Desktop with Kubernetes v1.35 enabled
Application tier: an API gateway fronting a backend API, with Redis as the cache and PostgreSQL as the primary datastore
Alerting: Alertmanager, used as the intended incident-signal source in our tested workflow
Observability: Grafana for metrics and dashboards, Loki for logs, and Tempo for distributed traces
AI model / OpenSRE version: OpenSRE v0.1 at commit
3c71f2fd2904, Claude Opus 4.8 via Claude Code, May to July 2026 PoC window (~6 hours end to end for stack, chaos, and investigate loops)
The reproduction kit lives at one2nc/ai_sre (OpenSRE): it contains observability stack, chaos targets, alert fixtures, and the investigate wrapper we used.
You can run it yourself if you want:
git clone https://github.com/one2nc/ai_sre.git && cd ai_sre/opensre
make env && make install && opensre onboard
make stack-up && make port-forward   # Grafana :3000, Alertmanager :9093
make chaos-postgres-down && sleep 60 && make investigate-stdin
make chaos-full-run walks postgres → redis → backend → gateway → all-down, with investigate + reset between each scenario. Scenario notes and screenshots are in the repo opensre/README.md.
The failure modes I put it through
I picked three failures any on-call engineer on a microservices stack would recognise, and triggered them with kubectl: mostly scaling things to zero, plus a CrashLoopBackOff. The make targets in the repo are just how I repeated the same mess cleanly.
PostgreSQL down: the primary database goes away, so every dependent service fails with it.
make chaos-postgres-downfiresAppPostgresDown.Backend down: the API tier goes offline, so the frontend and dependents start alerting.
make chaos-backend-downfiresAppBackendDown. I also ran a crashloop path (make chaos-backend-crashloop) that firesAppPodCrashLoopingalongside it.Redis down: the cache drops out, pushing latency and extra load onto Postgres.
make chaos-redis-downfiresAppRedisDown.
I ran each as a single alert and as part of a multi-alert burst. The all-services-down step in make chaos-full-run is the noisy version. From here on, "all three failure modes" refers to these.
Single alerts are where demos look good. Alert storms are where I decide whether something belongs in front of on-call.
Each dimension gets one of three marks:
(1) Meets the bar: sufficient for this dimension in the tested scenario.
(0) Partially meets: useful capability, but a material gap remains.
(-1) Does not meet: a gap blocks use for the tested scenario.
Actionability and control safety
Slack delivery worked. I triggered a failure, waited, and the summary landed in the channel. For a tool that does not remediate yet, staying read-only is the right call. It did not need cluster write permissions. I liked that.
What was missing was control over what it could read. I could not enforce a rule such as “never query Kubernetes Secrets or databases.” There was also no approval step before it sent a summary or fetched more context from connected systems.
That may be fine in a lower environment. I would not put it next to production credentials.
Eval: Partially meets (0)
Root cause analysis: accuracy and evidence
This is where the polished Slack update stopped being reassuring. I knew what I had broken, but the write-up still sounded confident about a different cause.
Across all three failure modes, the agent kept proposing causes it could not support with evidence. In one case, I had scaled replicas to zero with
kubectlor caused a CrashLoopBackOff. The agent suggested a Helm rollback, even though no rollback had happened.It did label the result “Inferred (not yet validated).” That is better than presenting it as fact. Still, I would not trust the output during an incident. If the agent cannot verify a cause, it should say what evidence is missing instead of filling the gap with a likely-sounding explanation.
Most of the time, it produced an alert summary for Slack rather than an RCA against a useful template.
Eval: Does not meet (-1)
Integrations and incident correlation
This decided the PoC for me. I ran both single-alert and multi-alert scenarios, and none of the outputs were something I would hand to an on-call engineer.
Three things kept showing up:
Alert ingestion was manual. In our test path, Alertmanager did not feed OpenSRE directly.
/api/v2/alertsreturns a JSON array, whileopensre investigate -i -expects webhook JSON with an"alerts"key. We addedmake investigate-stdinto convert the payload. That still meant fetching the alert and passing it to OpenSRE myself.It did not treat an alert burst as one incident. OpenSRE processed one alert per run and selected the first alert in sort order. There was no grouping or correlation. The only workaround was to loop through the remaining alerts manually.
Cluster context was tied to Helm. The tested workflow did not use Kubernetes API access. Workloads deployed with Kustomize or plain manifests were therefore outside the context the tool could retrieve. Helm is common, but it is rarely the only deployment method in a real environment.
Some integrations also failed during the PoC: Grafana returned 401, the binary install missed psycopg2, and Helm verification/setup did not work. We filed them upstream: #2500 (Grafana 401), #2459 (psycopg2, later fixed), #1973 (Helm, re-opened).
The issue was not that the tool crashed. It was that it could still return an answer after part of the evidence path had failed.
Eval: Does not meet (-1)
Service knowledge graph and context memory
I looked for the places where operational knowledge usually lives: Google Docs or Notion runbooks, similar past incidents, and Slack threads where someone had already solved the same problem.
In the v0.1 workflow we tested, I could not find or validate retrieval from any of them.
That means every similar page is a coldstart. A useful incident agent should be able to say: “We have seen this before. Here is the runbook, the previous RCA, and what worked last time.”
Eval: Does not meet (-1)
Security
Read-only by default is the right starting posture. The project describes guardrails that should detect credentials and mask them before data reaches the LLM.
In the CLI workflow we tested, I could not verify that masking worked end to end. For a regulated environment, that is enough to keep the tool away from production data until the path is proven.
This was not a penetration test or a formal data-flow review. It reflects only what we could observe in the workflow we ran.
Eval: Partially meets (0)
Scorecard for this PoC
Mapped back to the five dimensions, here is where OpenSRE landed in this PoC:
Dimension | Score | Why |
|---|---|---|
Actionability | (0) Partially meets | Slack delivery and read-only default are right; no gated remediation or approval path |
RCA quality | (-1) Does not meet | Unsupported causes; weak evidence trail; summarises more than it proves |
Integrations and correlation | (-1) Does not meet | Manual alert handoff; no multi-alert grouping; weak non-Helm Kubernetes context in our config |
Knowledge and memory | (-1) Does not meet | No validated runbooks, incident history, or chat retrieval in the tested workflow |
Security | (0) Partially meets | Read-only by design; sensitive-data masking was not validated end to end in the tested CLI workflow. |
Total | (-3) |
Is OpenSRE ready for production?
The intent behind OpenSRE is right, and starting read-only is the posture I want from an early agent. The path we tested is not one I would lean on during a real page. That, however, is not a permanent judgment on the project. Close the integration, correlation, and knowledge gaps, and the same failure matrix can be re-run honestly.
Where I landed for this PoC: defer, not reject.
Defer because the intent is worth another look. Not reject, and not adopt. Revisit once Alertmanager ingestion, multi-alert correlation, non-Helm Kubernetes context, and knowledge retrieval are mature enough to retest.
Before you adopt an AI SRE agent
Do not buy the demo. Put the agent under conditions that resemble real production. Insist on:
Single-alert and multi-alert scenarios. Do not stop at the clean demo path.
At least one broken or partial integration, to see whether the agent admits the gap or invents a cause.
Workloads that are not deployed the "happy" way in the vendor docs (plain
kubectl, Kustomize, mixed Helm).An explicit deny list for Secrets, databases, and other sensitive resources before any write path is enabled.
A templated RCA with evidence links. "Inferred" without recoverable proof fails the bar.
A check on whether the second similar incident is faster than the first. If the same incident starts from scratch every time, the tool is mostly summarising.
Happy-path demos will not tell you whether you can trust the agent at 1 AM. Honest evaluation needs noise, incomplete context, and partial failure of the surrounding platform.
Next up in this series: the same five dimensions against HolmesGPT, and a very different answer to what "AI SRE agent" means when you point it at a broken cluster.
At One2N we use the same production-first lens when helping teams adopt AI around reliability work.
An AI SRE agent is only as useful as the environment around it. It needs reliable telemetry, service context, and clear access boundaries before it can help during a real incident. That is the same foundation we build for AI Engineering and Site Reliability Engineering engagements.
Questions or pushback, reach me at hemant.kumar@one2n.in.
For more context from our team, check out: AI in SRE, AI-enabled SRE practices, and LLMs for incident response.
Over the past few months at One2N, we evaluated several AI SRE agents, ranging from open source to commercial, across incident investigations, alert triage, summarisation, and RCA workflows.
Some were useful. Others looked impressive in demos but were harder to operationalise. Some only showed their gaps in front of production systems.
Those tests became the baseline we use before we let any AI agent near a production incident.
Can we trust this AI SRE agent during incident triage, given the evidence and context it can access?
This post applies that bar to one open-source PoC: OpenSRE from TracerCloud, tested in a May to July 2026 PoC window on v0.1.
Short on time? Jump to the OpenSRE PoC scorecard →
The problem AI SRE agents need to solve: faster isolation
Most incidents are easy once you know where to look. The hard part is reducing time to isolate the fault, then preventing the same class of failure from recurring.
We track that internally as MTTI (mean time to isolate) and MTBF (mean time between failures). Isolation speed is where an AI SRE agent should earn its keep. While MTBF is usually preventative work after the page.
During an incident you are correlating logs, metrics, and traces, holding a timeline of recent changes in your head, and slowly building a mental map of a system you might not have designed. Eventually, that picture is enough to narrow the fault down. Most of the time it lives in the head of whoever has been on call the longest, and it walks out the door the day they leave.
Without access to the same evidence, the agent is often working with an incomplete picture which is not enough to shorten a real investigation.
Why this matters
I learned this the hard way. As a new engineer on my first on-call rotation, nervous because I barely knew the systems or the network topology yet, I got paged with: "Spark job failed inside prod-eks-XXX cluster." I spent 20–30 min tracing logs, deployment repos, Confluence pages, and old incidents before finding the cause: a persistent volume filled up, preventing Spark jobs from writing to storage.
I went to bump the PVC storage request, but it wouldn't expand: the StorageClass had allowVolumeExpansion: false. After confirming the CSI driver and volume supported expansion, we enabled allowVolumeExpansion, increased the PVC request, and verified the resize.
This was a one or two-line fix, buried behind systems I didn't know yet. That is the class of problem an AI SRE agent should compress. It is also why we do not adopt on demo vibes alone.
The types of AI SRE agents: incident response vs full production coverage
Not every tool that markets itself as "AI SRE" solves the same problem. So before we score a product, we place it in one of two camps.
Incident-focused tools which sit on the on-call loop.
They help diagnose the alert, draft the update, and support the postmortem.
Their primary focus is incident investigation and response; code-change analysis, cost optimisation, and ongoing service-topology learning are typically outside that core workflow.
In practice they are usually an AI layer on top of an incident or observability platform you already run, via MCP or tool calling.
Examples: OpenSRE (TracerCloud), Cleric, Parity, and the AI layers inside incident.io, Rootly, and PagerDuty.
Broader production-operations platforms watch more of the lifecycle of running production.
They look at health, deployments, scaling patterns, and sometimes Slack threads.
They tie that context back to alerts.
Between incidents they look for drift, usage trends, and waste.
When something breaks, they are not starting cold.
Examples: Resolve.ai, Datadog Bits AI SRE, Dynatrace Davis AI, Causely.
This evaluation focuses on incident-focused tools. If a product in that camp grows into a broader platform, even better. An agent that already knows what changed still beats one that wakes cold with the on-call engineer and has to build context from scratch.
How we evaluate AI SRE agents
During an incident, I care about three things: can I trust the investigation, can I trust the recommended actions (human-in-the-loop or autonomous), and can the agent stay inside the security lines we drew.
I would not give any AI SRE agent free rein to run arbitrary queries on a production database. If it pulls sensitive data and ships it outside the trust boundary without controls, that is a compliance incident with a chat UI waiting to happen.
So we score agents on five dimensions. Cost and wall-clock time matter, but they measure efficiency. These five measure if I would actually lean on the tool during an incident:
Actionability and control safety: Can it take or propose action when something breaks? Direct action may be fine in lower environments. Production needs stronger controls, especially across restricted networks and sensitive systems.
RCA quality: RCAs should be backed by evidence gathered while forming the hypothesis, not filled in with guesswork. LLM output is non-deterministic, so there'll always be edge cases, but the tool should say clearly when it didn't have enough information to form one.
Observability integrations and correlation: The agent needs access to the same evidence paths as an on-call engineer: telemetry, cloud and Kubernetes context, deployment history, and team knowledge. It must also surface failed or incomplete integrations. A confident answer on missing evidence is worse than no answer. This is why we care about homogeneous observability and reading SRE graphs carefully.
Incident memory, runbooks, and operational knowledge: If every similar page is a cold start, you are paying latency and tokens instead of compounding what the team already knows. Runbooks, incident history, and tribal knowledge should be retrievable when relevant.
Security: Can actions be gated? Can it run air-gapped or tightly controlled? Does it respect data handling rules before anything leaves the trust boundary?
Running OpenSRE through the evaluation criteria
When we tested it, OpenSRE was mainly a CLI on a laptop or a server inside the network. Its roadmap pointed toward becoming a full production-coverage platform, but it wasn't there yet, so we scored it based on its current capabilities.
Reference: OpenSRE v0.1. Demo of the backend-down run: 6-minute walkthrough.
Fig 1: OpenSRE architecture under evaluation.
Alerts enter via Alertmanager into the CLI; the agent queries datasources, calls an LLM, gathers context, and can send RCA output to Slack or Google Docs.
Test environment
I did not want a single-service hello-world. I wanted something closer to a customer estate: an app tier plus the observability path an on-call engineer would actually touch.
Fig 2: Kubernetes test stack for evaluating OpenSRE.
Platform: Docker Desktop with Kubernetes v1.35 enabled
Application tier: an API gateway fronting a backend API, with Redis as the cache and PostgreSQL as the primary datastore
Alerting: Alertmanager, used as the intended incident-signal source in our tested workflow
Observability: Grafana for metrics and dashboards, Loki for logs, and Tempo for distributed traces
AI model / OpenSRE version: OpenSRE v0.1 at commit
3c71f2fd2904, Claude Opus 4.8 via Claude Code, May to July 2026 PoC window (~6 hours end to end for stack, chaos, and investigate loops)
The reproduction kit lives at one2nc/ai_sre (OpenSRE): it contains observability stack, chaos targets, alert fixtures, and the investigate wrapper we used.
You can run it yourself if you want:
git clone https://github.com/one2nc/ai_sre.git && cd ai_sre/opensre
make env && make install && opensre onboard
make stack-up && make port-forward   # Grafana :3000, Alertmanager :9093
make chaos-postgres-down && sleep 60 && make investigate-stdin
make chaos-full-run walks postgres → redis → backend → gateway → all-down, with investigate + reset between each scenario. Scenario notes and screenshots are in the repo opensre/README.md.
The failure modes I put it through
I picked three failures any on-call engineer on a microservices stack would recognise, and triggered them with kubectl: mostly scaling things to zero, plus a CrashLoopBackOff. The make targets in the repo are just how I repeated the same mess cleanly.
PostgreSQL down: the primary database goes away, so every dependent service fails with it.
make chaos-postgres-downfiresAppPostgresDown.Backend down: the API tier goes offline, so the frontend and dependents start alerting.
make chaos-backend-downfiresAppBackendDown. I also ran a crashloop path (make chaos-backend-crashloop) that firesAppPodCrashLoopingalongside it.Redis down: the cache drops out, pushing latency and extra load onto Postgres.
make chaos-redis-downfiresAppRedisDown.
I ran each as a single alert and as part of a multi-alert burst. The all-services-down step in make chaos-full-run is the noisy version. From here on, "all three failure modes" refers to these.
Single alerts are where demos look good. Alert storms are where I decide whether something belongs in front of on-call.
Each dimension gets one of three marks:
(1) Meets the bar: sufficient for this dimension in the tested scenario.
(0) Partially meets: useful capability, but a material gap remains.
(-1) Does not meet: a gap blocks use for the tested scenario.
Actionability and control safety
Slack delivery worked. I triggered a failure, waited, and the summary landed in the channel. For a tool that does not remediate yet, staying read-only is the right call. It did not need cluster write permissions. I liked that.
What was missing was control over what it could read. I could not enforce a rule such as “never query Kubernetes Secrets or databases.” There was also no approval step before it sent a summary or fetched more context from connected systems.
That may be fine in a lower environment. I would not put it next to production credentials.
Eval: Partially meets (0)
Root cause analysis: accuracy and evidence
This is where the polished Slack update stopped being reassuring. I knew what I had broken, but the write-up still sounded confident about a different cause.
Across all three failure modes, the agent kept proposing causes it could not support with evidence. In one case, I had scaled replicas to zero with
kubectlor caused a CrashLoopBackOff. The agent suggested a Helm rollback, even though no rollback had happened.It did label the result “Inferred (not yet validated).” That is better than presenting it as fact. Still, I would not trust the output during an incident. If the agent cannot verify a cause, it should say what evidence is missing instead of filling the gap with a likely-sounding explanation.
Most of the time, it produced an alert summary for Slack rather than an RCA against a useful template.
Eval: Does not meet (-1)
Integrations and incident correlation
This decided the PoC for me. I ran both single-alert and multi-alert scenarios, and none of the outputs were something I would hand to an on-call engineer.
Three things kept showing up:
Alert ingestion was manual. In our test path, Alertmanager did not feed OpenSRE directly.
/api/v2/alertsreturns a JSON array, whileopensre investigate -i -expects webhook JSON with an"alerts"key. We addedmake investigate-stdinto convert the payload. That still meant fetching the alert and passing it to OpenSRE myself.It did not treat an alert burst as one incident. OpenSRE processed one alert per run and selected the first alert in sort order. There was no grouping or correlation. The only workaround was to loop through the remaining alerts manually.
Cluster context was tied to Helm. The tested workflow did not use Kubernetes API access. Workloads deployed with Kustomize or plain manifests were therefore outside the context the tool could retrieve. Helm is common, but it is rarely the only deployment method in a real environment.
Some integrations also failed during the PoC: Grafana returned 401, the binary install missed psycopg2, and Helm verification/setup did not work. We filed them upstream: #2500 (Grafana 401), #2459 (psycopg2, later fixed), #1973 (Helm, re-opened).
The issue was not that the tool crashed. It was that it could still return an answer after part of the evidence path had failed.
Eval: Does not meet (-1)
Service knowledge graph and context memory
I looked for the places where operational knowledge usually lives: Google Docs or Notion runbooks, similar past incidents, and Slack threads where someone had already solved the same problem.
In the v0.1 workflow we tested, I could not find or validate retrieval from any of them.
That means every similar page is a coldstart. A useful incident agent should be able to say: “We have seen this before. Here is the runbook, the previous RCA, and what worked last time.”
Eval: Does not meet (-1)
Security
Read-only by default is the right starting posture. The project describes guardrails that should detect credentials and mask them before data reaches the LLM.
In the CLI workflow we tested, I could not verify that masking worked end to end. For a regulated environment, that is enough to keep the tool away from production data until the path is proven.
This was not a penetration test or a formal data-flow review. It reflects only what we could observe in the workflow we ran.
Eval: Partially meets (0)
Scorecard for this PoC
Mapped back to the five dimensions, here is where OpenSRE landed in this PoC:
Dimension | Score | Why |
|---|---|---|
Actionability | (0) Partially meets | Slack delivery and read-only default are right; no gated remediation or approval path |
RCA quality | (-1) Does not meet | Unsupported causes; weak evidence trail; summarises more than it proves |
Integrations and correlation | (-1) Does not meet | Manual alert handoff; no multi-alert grouping; weak non-Helm Kubernetes context in our config |
Knowledge and memory | (-1) Does not meet | No validated runbooks, incident history, or chat retrieval in the tested workflow |
Security | (0) Partially meets | Read-only by design; sensitive-data masking was not validated end to end in the tested CLI workflow. |
Total | (-3) |
Is OpenSRE ready for production?
The intent behind OpenSRE is right, and starting read-only is the posture I want from an early agent. The path we tested is not one I would lean on during a real page. That, however, is not a permanent judgment on the project. Close the integration, correlation, and knowledge gaps, and the same failure matrix can be re-run honestly.
Where I landed for this PoC: defer, not reject.
Defer because the intent is worth another look. Not reject, and not adopt. Revisit once Alertmanager ingestion, multi-alert correlation, non-Helm Kubernetes context, and knowledge retrieval are mature enough to retest.
Before you adopt an AI SRE agent
Do not buy the demo. Put the agent under conditions that resemble real production. Insist on:
Single-alert and multi-alert scenarios. Do not stop at the clean demo path.
At least one broken or partial integration, to see whether the agent admits the gap or invents a cause.
Workloads that are not deployed the "happy" way in the vendor docs (plain
kubectl, Kustomize, mixed Helm).An explicit deny list for Secrets, databases, and other sensitive resources before any write path is enabled.
A templated RCA with evidence links. "Inferred" without recoverable proof fails the bar.
A check on whether the second similar incident is faster than the first. If the same incident starts from scratch every time, the tool is mostly summarising.
Happy-path demos will not tell you whether you can trust the agent at 1 AM. Honest evaluation needs noise, incomplete context, and partial failure of the surrounding platform.
Next up in this series: the same five dimensions against HolmesGPT, and a very different answer to what "AI SRE agent" means when you point it at a broken cluster.
At One2N we use the same production-first lens when helping teams adopt AI around reliability work.
An AI SRE agent is only as useful as the environment around it. It needs reliable telemetry, service context, and clear access boundaries before it can help during a real incident. That is the same foundation we build for AI Engineering and Site Reliability Engineering engagements.
Questions or pushback, reach me at hemant.kumar@one2n.in.
For more context from our team, check out: AI in SRE, AI-enabled SRE practices, and LLMs for incident response.
Over the past few months at One2N, we evaluated several AI SRE agents, ranging from open source to commercial, across incident investigations, alert triage, summarisation, and RCA workflows.
Some were useful. Others looked impressive in demos but were harder to operationalise. Some only showed their gaps in front of production systems.
Those tests became the baseline we use before we let any AI agent near a production incident.
Can we trust this AI SRE agent during incident triage, given the evidence and context it can access?
This post applies that bar to one open-source PoC: OpenSRE from TracerCloud, tested in a May to July 2026 PoC window on v0.1.
Short on time? Jump to the OpenSRE PoC scorecard →
The problem AI SRE agents need to solve: faster isolation
Most incidents are easy once you know where to look. The hard part is reducing time to isolate the fault, then preventing the same class of failure from recurring.
We track that internally as MTTI (mean time to isolate) and MTBF (mean time between failures). Isolation speed is where an AI SRE agent should earn its keep. While MTBF is usually preventative work after the page.
During an incident you are correlating logs, metrics, and traces, holding a timeline of recent changes in your head, and slowly building a mental map of a system you might not have designed. Eventually, that picture is enough to narrow the fault down. Most of the time it lives in the head of whoever has been on call the longest, and it walks out the door the day they leave.
Without access to the same evidence, the agent is often working with an incomplete picture which is not enough to shorten a real investigation.
Why this matters
I learned this the hard way. As a new engineer on my first on-call rotation, nervous because I barely knew the systems or the network topology yet, I got paged with: "Spark job failed inside prod-eks-XXX cluster." I spent 20–30 min tracing logs, deployment repos, Confluence pages, and old incidents before finding the cause: a persistent volume filled up, preventing Spark jobs from writing to storage.
I went to bump the PVC storage request, but it wouldn't expand: the StorageClass had allowVolumeExpansion: false. After confirming the CSI driver and volume supported expansion, we enabled allowVolumeExpansion, increased the PVC request, and verified the resize.
This was a one or two-line fix, buried behind systems I didn't know yet. That is the class of problem an AI SRE agent should compress. It is also why we do not adopt on demo vibes alone.
The types of AI SRE agents: incident response vs full production coverage
Not every tool that markets itself as "AI SRE" solves the same problem. So before we score a product, we place it in one of two camps.
Incident-focused tools which sit on the on-call loop.
They help diagnose the alert, draft the update, and support the postmortem.
Their primary focus is incident investigation and response; code-change analysis, cost optimisation, and ongoing service-topology learning are typically outside that core workflow.
In practice they are usually an AI layer on top of an incident or observability platform you already run, via MCP or tool calling.
Examples: OpenSRE (TracerCloud), Cleric, Parity, and the AI layers inside incident.io, Rootly, and PagerDuty.
Broader production-operations platforms watch more of the lifecycle of running production.
They look at health, deployments, scaling patterns, and sometimes Slack threads.
They tie that context back to alerts.
Between incidents they look for drift, usage trends, and waste.
When something breaks, they are not starting cold.
Examples: Resolve.ai, Datadog Bits AI SRE, Dynatrace Davis AI, Causely.
This evaluation focuses on incident-focused tools. If a product in that camp grows into a broader platform, even better. An agent that already knows what changed still beats one that wakes cold with the on-call engineer and has to build context from scratch.
How we evaluate AI SRE agents
During an incident, I care about three things: can I trust the investigation, can I trust the recommended actions (human-in-the-loop or autonomous), and can the agent stay inside the security lines we drew.
I would not give any AI SRE agent free rein to run arbitrary queries on a production database. If it pulls sensitive data and ships it outside the trust boundary without controls, that is a compliance incident with a chat UI waiting to happen.
So we score agents on five dimensions. Cost and wall-clock time matter, but they measure efficiency. These five measure if I would actually lean on the tool during an incident:
Actionability and control safety: Can it take or propose action when something breaks? Direct action may be fine in lower environments. Production needs stronger controls, especially across restricted networks and sensitive systems.
RCA quality: RCAs should be backed by evidence gathered while forming the hypothesis, not filled in with guesswork. LLM output is non-deterministic, so there'll always be edge cases, but the tool should say clearly when it didn't have enough information to form one.
Observability integrations and correlation: The agent needs access to the same evidence paths as an on-call engineer: telemetry, cloud and Kubernetes context, deployment history, and team knowledge. It must also surface failed or incomplete integrations. A confident answer on missing evidence is worse than no answer. This is why we care about homogeneous observability and reading SRE graphs carefully.
Incident memory, runbooks, and operational knowledge: If every similar page is a cold start, you are paying latency and tokens instead of compounding what the team already knows. Runbooks, incident history, and tribal knowledge should be retrievable when relevant.
Security: Can actions be gated? Can it run air-gapped or tightly controlled? Does it respect data handling rules before anything leaves the trust boundary?
Running OpenSRE through the evaluation criteria
When we tested it, OpenSRE was mainly a CLI on a laptop or a server inside the network. Its roadmap pointed toward becoming a full production-coverage platform, but it wasn't there yet, so we scored it based on its current capabilities.
Reference: OpenSRE v0.1. Demo of the backend-down run: 6-minute walkthrough.
Fig 1: OpenSRE architecture under evaluation.
Alerts enter via Alertmanager into the CLI; the agent queries datasources, calls an LLM, gathers context, and can send RCA output to Slack or Google Docs.
Test environment
I did not want a single-service hello-world. I wanted something closer to a customer estate: an app tier plus the observability path an on-call engineer would actually touch.
Fig 2: Kubernetes test stack for evaluating OpenSRE.
Platform: Docker Desktop with Kubernetes v1.35 enabled
Application tier: an API gateway fronting a backend API, with Redis as the cache and PostgreSQL as the primary datastore
Alerting: Alertmanager, used as the intended incident-signal source in our tested workflow
Observability: Grafana for metrics and dashboards, Loki for logs, and Tempo for distributed traces
AI model / OpenSRE version: OpenSRE v0.1 at commit
3c71f2fd2904, Claude Opus 4.8 via Claude Code, May to July 2026 PoC window (~6 hours end to end for stack, chaos, and investigate loops)
The reproduction kit lives at one2nc/ai_sre (OpenSRE): it contains observability stack, chaos targets, alert fixtures, and the investigate wrapper we used.
You can run it yourself if you want:
git clone https://github.com/one2nc/ai_sre.git && cd ai_sre/opensre
make env && make install && opensre onboard
make stack-up && make port-forward   # Grafana :3000, Alertmanager :9093
make chaos-postgres-down && sleep 60 && make investigate-stdin
make chaos-full-run walks postgres → redis → backend → gateway → all-down, with investigate + reset between each scenario. Scenario notes and screenshots are in the repo opensre/README.md.
The failure modes I put it through
I picked three failures any on-call engineer on a microservices stack would recognise, and triggered them with kubectl: mostly scaling things to zero, plus a CrashLoopBackOff. The make targets in the repo are just how I repeated the same mess cleanly.
PostgreSQL down: the primary database goes away, so every dependent service fails with it.
make chaos-postgres-downfiresAppPostgresDown.Backend down: the API tier goes offline, so the frontend and dependents start alerting.
make chaos-backend-downfiresAppBackendDown. I also ran a crashloop path (make chaos-backend-crashloop) that firesAppPodCrashLoopingalongside it.Redis down: the cache drops out, pushing latency and extra load onto Postgres.
make chaos-redis-downfiresAppRedisDown.
I ran each as a single alert and as part of a multi-alert burst. The all-services-down step in make chaos-full-run is the noisy version. From here on, "all three failure modes" refers to these.
Single alerts are where demos look good. Alert storms are where I decide whether something belongs in front of on-call.
Each dimension gets one of three marks:
(1) Meets the bar: sufficient for this dimension in the tested scenario.
(0) Partially meets: useful capability, but a material gap remains.
(-1) Does not meet: a gap blocks use for the tested scenario.
Actionability and control safety
Slack delivery worked. I triggered a failure, waited, and the summary landed in the channel. For a tool that does not remediate yet, staying read-only is the right call. It did not need cluster write permissions. I liked that.
What was missing was control over what it could read. I could not enforce a rule such as “never query Kubernetes Secrets or databases.” There was also no approval step before it sent a summary or fetched more context from connected systems.
That may be fine in a lower environment. I would not put it next to production credentials.
Eval: Partially meets (0)
Root cause analysis: accuracy and evidence
This is where the polished Slack update stopped being reassuring. I knew what I had broken, but the write-up still sounded confident about a different cause.
Across all three failure modes, the agent kept proposing causes it could not support with evidence. In one case, I had scaled replicas to zero with
kubectlor caused a CrashLoopBackOff. The agent suggested a Helm rollback, even though no rollback had happened.It did label the result “Inferred (not yet validated).” That is better than presenting it as fact. Still, I would not trust the output during an incident. If the agent cannot verify a cause, it should say what evidence is missing instead of filling the gap with a likely-sounding explanation.
Most of the time, it produced an alert summary for Slack rather than an RCA against a useful template.
Eval: Does not meet (-1)
Integrations and incident correlation
This decided the PoC for me. I ran both single-alert and multi-alert scenarios, and none of the outputs were something I would hand to an on-call engineer.
Three things kept showing up:
Alert ingestion was manual. In our test path, Alertmanager did not feed OpenSRE directly.
/api/v2/alertsreturns a JSON array, whileopensre investigate -i -expects webhook JSON with an"alerts"key. We addedmake investigate-stdinto convert the payload. That still meant fetching the alert and passing it to OpenSRE myself.It did not treat an alert burst as one incident. OpenSRE processed one alert per run and selected the first alert in sort order. There was no grouping or correlation. The only workaround was to loop through the remaining alerts manually.
Cluster context was tied to Helm. The tested workflow did not use Kubernetes API access. Workloads deployed with Kustomize or plain manifests were therefore outside the context the tool could retrieve. Helm is common, but it is rarely the only deployment method in a real environment.
Some integrations also failed during the PoC: Grafana returned 401, the binary install missed psycopg2, and Helm verification/setup did not work. We filed them upstream: #2500 (Grafana 401), #2459 (psycopg2, later fixed), #1973 (Helm, re-opened).
The issue was not that the tool crashed. It was that it could still return an answer after part of the evidence path had failed.
Eval: Does not meet (-1)
Service knowledge graph and context memory
I looked for the places where operational knowledge usually lives: Google Docs or Notion runbooks, similar past incidents, and Slack threads where someone had already solved the same problem.
In the v0.1 workflow we tested, I could not find or validate retrieval from any of them.
That means every similar page is a coldstart. A useful incident agent should be able to say: “We have seen this before. Here is the runbook, the previous RCA, and what worked last time.”
Eval: Does not meet (-1)
Security
Read-only by default is the right starting posture. The project describes guardrails that should detect credentials and mask them before data reaches the LLM.
In the CLI workflow we tested, I could not verify that masking worked end to end. For a regulated environment, that is enough to keep the tool away from production data until the path is proven.
This was not a penetration test or a formal data-flow review. It reflects only what we could observe in the workflow we ran.
Eval: Partially meets (0)
Scorecard for this PoC
Mapped back to the five dimensions, here is where OpenSRE landed in this PoC:
Dimension | Score | Why |
|---|---|---|
Actionability | (0) Partially meets | Slack delivery and read-only default are right; no gated remediation or approval path |
RCA quality | (-1) Does not meet | Unsupported causes; weak evidence trail; summarises more than it proves |
Integrations and correlation | (-1) Does not meet | Manual alert handoff; no multi-alert grouping; weak non-Helm Kubernetes context in our config |
Knowledge and memory | (-1) Does not meet | No validated runbooks, incident history, or chat retrieval in the tested workflow |
Security | (0) Partially meets | Read-only by design; sensitive-data masking was not validated end to end in the tested CLI workflow. |
Total | (-3) |
Is OpenSRE ready for production?
The intent behind OpenSRE is right, and starting read-only is the posture I want from an early agent. The path we tested is not one I would lean on during a real page. That, however, is not a permanent judgment on the project. Close the integration, correlation, and knowledge gaps, and the same failure matrix can be re-run honestly.
Where I landed for this PoC: defer, not reject.
Defer because the intent is worth another look. Not reject, and not adopt. Revisit once Alertmanager ingestion, multi-alert correlation, non-Helm Kubernetes context, and knowledge retrieval are mature enough to retest.
Before you adopt an AI SRE agent
Do not buy the demo. Put the agent under conditions that resemble real production. Insist on:
Single-alert and multi-alert scenarios. Do not stop at the clean demo path.
At least one broken or partial integration, to see whether the agent admits the gap or invents a cause.
Workloads that are not deployed the "happy" way in the vendor docs (plain
kubectl, Kustomize, mixed Helm).An explicit deny list for Secrets, databases, and other sensitive resources before any write path is enabled.
A templated RCA with evidence links. "Inferred" without recoverable proof fails the bar.
A check on whether the second similar incident is faster than the first. If the same incident starts from scratch every time, the tool is mostly summarising.
Happy-path demos will not tell you whether you can trust the agent at 1 AM. Honest evaluation needs noise, incomplete context, and partial failure of the surrounding platform.
Next up in this series: the same five dimensions against HolmesGPT, and a very different answer to what "AI SRE agent" means when you point it at a broken cluster.
At One2N we use the same production-first lens when helping teams adopt AI around reliability work.
An AI SRE agent is only as useful as the environment around it. It needs reliable telemetry, service context, and clear access boundaries before it can help during a real incident. That is the same foundation we build for AI Engineering and Site Reliability Engineering engagements.
Questions or pushback, reach me at hemant.kumar@one2n.in.
For more context from our team, check out: AI in SRE, AI-enabled SRE practices, and LLMs for incident response.
Over the past few months at One2N, we evaluated several AI SRE agents, ranging from open source to commercial, across incident investigations, alert triage, summarisation, and RCA workflows.
Some were useful. Others looked impressive in demos but were harder to operationalise. Some only showed their gaps in front of production systems.
Those tests became the baseline we use before we let any AI agent near a production incident.
Can we trust this AI SRE agent during incident triage, given the evidence and context it can access?
This post applies that bar to one open-source PoC: OpenSRE from TracerCloud, tested in a May to July 2026 PoC window on v0.1.
Short on time? Jump to the OpenSRE PoC scorecard →
The problem AI SRE agents need to solve: faster isolation
Most incidents are easy once you know where to look. The hard part is reducing time to isolate the fault, then preventing the same class of failure from recurring.
We track that internally as MTTI (mean time to isolate) and MTBF (mean time between failures). Isolation speed is where an AI SRE agent should earn its keep. While MTBF is usually preventative work after the page.
During an incident you are correlating logs, metrics, and traces, holding a timeline of recent changes in your head, and slowly building a mental map of a system you might not have designed. Eventually, that picture is enough to narrow the fault down. Most of the time it lives in the head of whoever has been on call the longest, and it walks out the door the day they leave.
Without access to the same evidence, the agent is often working with an incomplete picture which is not enough to shorten a real investigation.
Why this matters
I learned this the hard way. As a new engineer on my first on-call rotation, nervous because I barely knew the systems or the network topology yet, I got paged with: "Spark job failed inside prod-eks-XXX cluster." I spent 20–30 min tracing logs, deployment repos, Confluence pages, and old incidents before finding the cause: a persistent volume filled up, preventing Spark jobs from writing to storage.
I went to bump the PVC storage request, but it wouldn't expand: the StorageClass had allowVolumeExpansion: false. After confirming the CSI driver and volume supported expansion, we enabled allowVolumeExpansion, increased the PVC request, and verified the resize.
This was a one or two-line fix, buried behind systems I didn't know yet. That is the class of problem an AI SRE agent should compress. It is also why we do not adopt on demo vibes alone.
The types of AI SRE agents: incident response vs full production coverage
Not every tool that markets itself as "AI SRE" solves the same problem. So before we score a product, we place it in one of two camps.
Incident-focused tools which sit on the on-call loop.
They help diagnose the alert, draft the update, and support the postmortem.
Their primary focus is incident investigation and response; code-change analysis, cost optimisation, and ongoing service-topology learning are typically outside that core workflow.
In practice they are usually an AI layer on top of an incident or observability platform you already run, via MCP or tool calling.
Examples: OpenSRE (TracerCloud), Cleric, Parity, and the AI layers inside incident.io, Rootly, and PagerDuty.
Broader production-operations platforms watch more of the lifecycle of running production.
They look at health, deployments, scaling patterns, and sometimes Slack threads.
They tie that context back to alerts.
Between incidents they look for drift, usage trends, and waste.
When something breaks, they are not starting cold.
Examples: Resolve.ai, Datadog Bits AI SRE, Dynatrace Davis AI, Causely.
This evaluation focuses on incident-focused tools. If a product in that camp grows into a broader platform, even better. An agent that already knows what changed still beats one that wakes cold with the on-call engineer and has to build context from scratch.
How we evaluate AI SRE agents
During an incident, I care about three things: can I trust the investigation, can I trust the recommended actions (human-in-the-loop or autonomous), and can the agent stay inside the security lines we drew.
I would not give any AI SRE agent free rein to run arbitrary queries on a production database. If it pulls sensitive data and ships it outside the trust boundary without controls, that is a compliance incident with a chat UI waiting to happen.
So we score agents on five dimensions. Cost and wall-clock time matter, but they measure efficiency. These five measure if I would actually lean on the tool during an incident:
Actionability and control safety: Can it take or propose action when something breaks? Direct action may be fine in lower environments. Production needs stronger controls, especially across restricted networks and sensitive systems.
RCA quality: RCAs should be backed by evidence gathered while forming the hypothesis, not filled in with guesswork. LLM output is non-deterministic, so there'll always be edge cases, but the tool should say clearly when it didn't have enough information to form one.
Observability integrations and correlation: The agent needs access to the same evidence paths as an on-call engineer: telemetry, cloud and Kubernetes context, deployment history, and team knowledge. It must also surface failed or incomplete integrations. A confident answer on missing evidence is worse than no answer. This is why we care about homogeneous observability and reading SRE graphs carefully.
Incident memory, runbooks, and operational knowledge: If every similar page is a cold start, you are paying latency and tokens instead of compounding what the team already knows. Runbooks, incident history, and tribal knowledge should be retrievable when relevant.
Security: Can actions be gated? Can it run air-gapped or tightly controlled? Does it respect data handling rules before anything leaves the trust boundary?
Running OpenSRE through the evaluation criteria
When we tested it, OpenSRE was mainly a CLI on a laptop or a server inside the network. Its roadmap pointed toward becoming a full production-coverage platform, but it wasn't there yet, so we scored it based on its current capabilities.
Reference: OpenSRE v0.1. Demo of the backend-down run: 6-minute walkthrough.
Fig 1: OpenSRE architecture under evaluation.
Alerts enter via Alertmanager into the CLI; the agent queries datasources, calls an LLM, gathers context, and can send RCA output to Slack or Google Docs.
Test environment
I did not want a single-service hello-world. I wanted something closer to a customer estate: an app tier plus the observability path an on-call engineer would actually touch.
Fig 2: Kubernetes test stack for evaluating OpenSRE.
Platform: Docker Desktop with Kubernetes v1.35 enabled
Application tier: an API gateway fronting a backend API, with Redis as the cache and PostgreSQL as the primary datastore
Alerting: Alertmanager, used as the intended incident-signal source in our tested workflow
Observability: Grafana for metrics and dashboards, Loki for logs, and Tempo for distributed traces
AI model / OpenSRE version: OpenSRE v0.1 at commit
3c71f2fd2904, Claude Opus 4.8 via Claude Code, May to July 2026 PoC window (~6 hours end to end for stack, chaos, and investigate loops)
The reproduction kit lives at one2nc/ai_sre (OpenSRE): it contains observability stack, chaos targets, alert fixtures, and the investigate wrapper we used.
You can run it yourself if you want:
git clone https://github.com/one2nc/ai_sre.git && cd ai_sre/opensre
make env && make install && opensre onboard
make stack-up && make port-forward   # Grafana :3000, Alertmanager :9093
make chaos-postgres-down && sleep 60 && make investigate-stdin
make chaos-full-run walks postgres → redis → backend → gateway → all-down, with investigate + reset between each scenario. Scenario notes and screenshots are in the repo opensre/README.md.
The failure modes I put it through
I picked three failures any on-call engineer on a microservices stack would recognise, and triggered them with kubectl: mostly scaling things to zero, plus a CrashLoopBackOff. The make targets in the repo are just how I repeated the same mess cleanly.
PostgreSQL down: the primary database goes away, so every dependent service fails with it.
make chaos-postgres-downfiresAppPostgresDown.Backend down: the API tier goes offline, so the frontend and dependents start alerting.
make chaos-backend-downfiresAppBackendDown. I also ran a crashloop path (make chaos-backend-crashloop) that firesAppPodCrashLoopingalongside it.Redis down: the cache drops out, pushing latency and extra load onto Postgres.
make chaos-redis-downfiresAppRedisDown.
I ran each as a single alert and as part of a multi-alert burst. The all-services-down step in make chaos-full-run is the noisy version. From here on, "all three failure modes" refers to these.
Single alerts are where demos look good. Alert storms are where I decide whether something belongs in front of on-call.
Each dimension gets one of three marks:
(1) Meets the bar: sufficient for this dimension in the tested scenario.
(0) Partially meets: useful capability, but a material gap remains.
(-1) Does not meet: a gap blocks use for the tested scenario.
Actionability and control safety
Slack delivery worked. I triggered a failure, waited, and the summary landed in the channel. For a tool that does not remediate yet, staying read-only is the right call. It did not need cluster write permissions. I liked that.
What was missing was control over what it could read. I could not enforce a rule such as “never query Kubernetes Secrets or databases.” There was also no approval step before it sent a summary or fetched more context from connected systems.
That may be fine in a lower environment. I would not put it next to production credentials.
Eval: Partially meets (0)
Root cause analysis: accuracy and evidence
This is where the polished Slack update stopped being reassuring. I knew what I had broken, but the write-up still sounded confident about a different cause.
Across all three failure modes, the agent kept proposing causes it could not support with evidence. In one case, I had scaled replicas to zero with
kubectlor caused a CrashLoopBackOff. The agent suggested a Helm rollback, even though no rollback had happened.It did label the result “Inferred (not yet validated).” That is better than presenting it as fact. Still, I would not trust the output during an incident. If the agent cannot verify a cause, it should say what evidence is missing instead of filling the gap with a likely-sounding explanation.
Most of the time, it produced an alert summary for Slack rather than an RCA against a useful template.
Eval: Does not meet (-1)
Integrations and incident correlation
This decided the PoC for me. I ran both single-alert and multi-alert scenarios, and none of the outputs were something I would hand to an on-call engineer.
Three things kept showing up:
Alert ingestion was manual. In our test path, Alertmanager did not feed OpenSRE directly.
/api/v2/alertsreturns a JSON array, whileopensre investigate -i -expects webhook JSON with an"alerts"key. We addedmake investigate-stdinto convert the payload. That still meant fetching the alert and passing it to OpenSRE myself.It did not treat an alert burst as one incident. OpenSRE processed one alert per run and selected the first alert in sort order. There was no grouping or correlation. The only workaround was to loop through the remaining alerts manually.
Cluster context was tied to Helm. The tested workflow did not use Kubernetes API access. Workloads deployed with Kustomize or plain manifests were therefore outside the context the tool could retrieve. Helm is common, but it is rarely the only deployment method in a real environment.
Some integrations also failed during the PoC: Grafana returned 401, the binary install missed psycopg2, and Helm verification/setup did not work. We filed them upstream: #2500 (Grafana 401), #2459 (psycopg2, later fixed), #1973 (Helm, re-opened).
The issue was not that the tool crashed. It was that it could still return an answer after part of the evidence path had failed.
Eval: Does not meet (-1)
Service knowledge graph and context memory
I looked for the places where operational knowledge usually lives: Google Docs or Notion runbooks, similar past incidents, and Slack threads where someone had already solved the same problem.
In the v0.1 workflow we tested, I could not find or validate retrieval from any of them.
That means every similar page is a coldstart. A useful incident agent should be able to say: “We have seen this before. Here is the runbook, the previous RCA, and what worked last time.”
Eval: Does not meet (-1)
Security
Read-only by default is the right starting posture. The project describes guardrails that should detect credentials and mask them before data reaches the LLM.
In the CLI workflow we tested, I could not verify that masking worked end to end. For a regulated environment, that is enough to keep the tool away from production data until the path is proven.
This was not a penetration test or a formal data-flow review. It reflects only what we could observe in the workflow we ran.
Eval: Partially meets (0)
Scorecard for this PoC
Mapped back to the five dimensions, here is where OpenSRE landed in this PoC:
Dimension | Score | Why |
|---|---|---|
Actionability | (0) Partially meets | Slack delivery and read-only default are right; no gated remediation or approval path |
RCA quality | (-1) Does not meet | Unsupported causes; weak evidence trail; summarises more than it proves |
Integrations and correlation | (-1) Does not meet | Manual alert handoff; no multi-alert grouping; weak non-Helm Kubernetes context in our config |
Knowledge and memory | (-1) Does not meet | No validated runbooks, incident history, or chat retrieval in the tested workflow |
Security | (0) Partially meets | Read-only by design; sensitive-data masking was not validated end to end in the tested CLI workflow. |
Total | (-3) |
Is OpenSRE ready for production?
The intent behind OpenSRE is right, and starting read-only is the posture I want from an early agent. The path we tested is not one I would lean on during a real page. That, however, is not a permanent judgment on the project. Close the integration, correlation, and knowledge gaps, and the same failure matrix can be re-run honestly.
Where I landed for this PoC: defer, not reject.
Defer because the intent is worth another look. Not reject, and not adopt. Revisit once Alertmanager ingestion, multi-alert correlation, non-Helm Kubernetes context, and knowledge retrieval are mature enough to retest.
Before you adopt an AI SRE agent
Do not buy the demo. Put the agent under conditions that resemble real production. Insist on:
Single-alert and multi-alert scenarios. Do not stop at the clean demo path.
At least one broken or partial integration, to see whether the agent admits the gap or invents a cause.
Workloads that are not deployed the "happy" way in the vendor docs (plain
kubectl, Kustomize, mixed Helm).An explicit deny list for Secrets, databases, and other sensitive resources before any write path is enabled.
A templated RCA with evidence links. "Inferred" without recoverable proof fails the bar.
A check on whether the second similar incident is faster than the first. If the same incident starts from scratch every time, the tool is mostly summarising.
Happy-path demos will not tell you whether you can trust the agent at 1 AM. Honest evaluation needs noise, incomplete context, and partial failure of the surrounding platform.
Next up in this series: the same five dimensions against HolmesGPT, and a very different answer to what "AI SRE agent" means when you point it at a broken cluster.
At One2N we use the same production-first lens when helping teams adopt AI around reliability work.
An AI SRE agent is only as useful as the environment around it. It needs reliable telemetry, service context, and clear access boundaries before it can help during a real incident. That is the same foundation we build for AI Engineering and Site Reliability Engineering engagements.
Questions or pushback, reach me at hemant.kumar@one2n.in.
For more context from our team, check out: AI in SRE, AI-enabled SRE practices, and LLMs for incident response.
Share
Share
On this page
Section
On this page
In this post
section