If you've read our post on OpenTelemetry fundamentals, you know that logs, metrics, and traces are the three pillars of observability. But here's what we didn't cover: how to actually make observability work at scale.
When I deployed OpenTelemetry collectors to production, I quickly learned that collecting data is just the first step. The real challenge is handling that data reliably, cost-effectively, and at volume.
This blog tries to address these challenges. Some of the takeaways we would like to focus on are:
How to handle rate limits without losing data
Why collectors crash during traffic spikes and how to prevent it
How to filter noise without dropping important data
How to enrich telemetry with Kubernetes context automatically
Why trace sampling is harder than it seems
How to build a two-tier collector architecture that scales
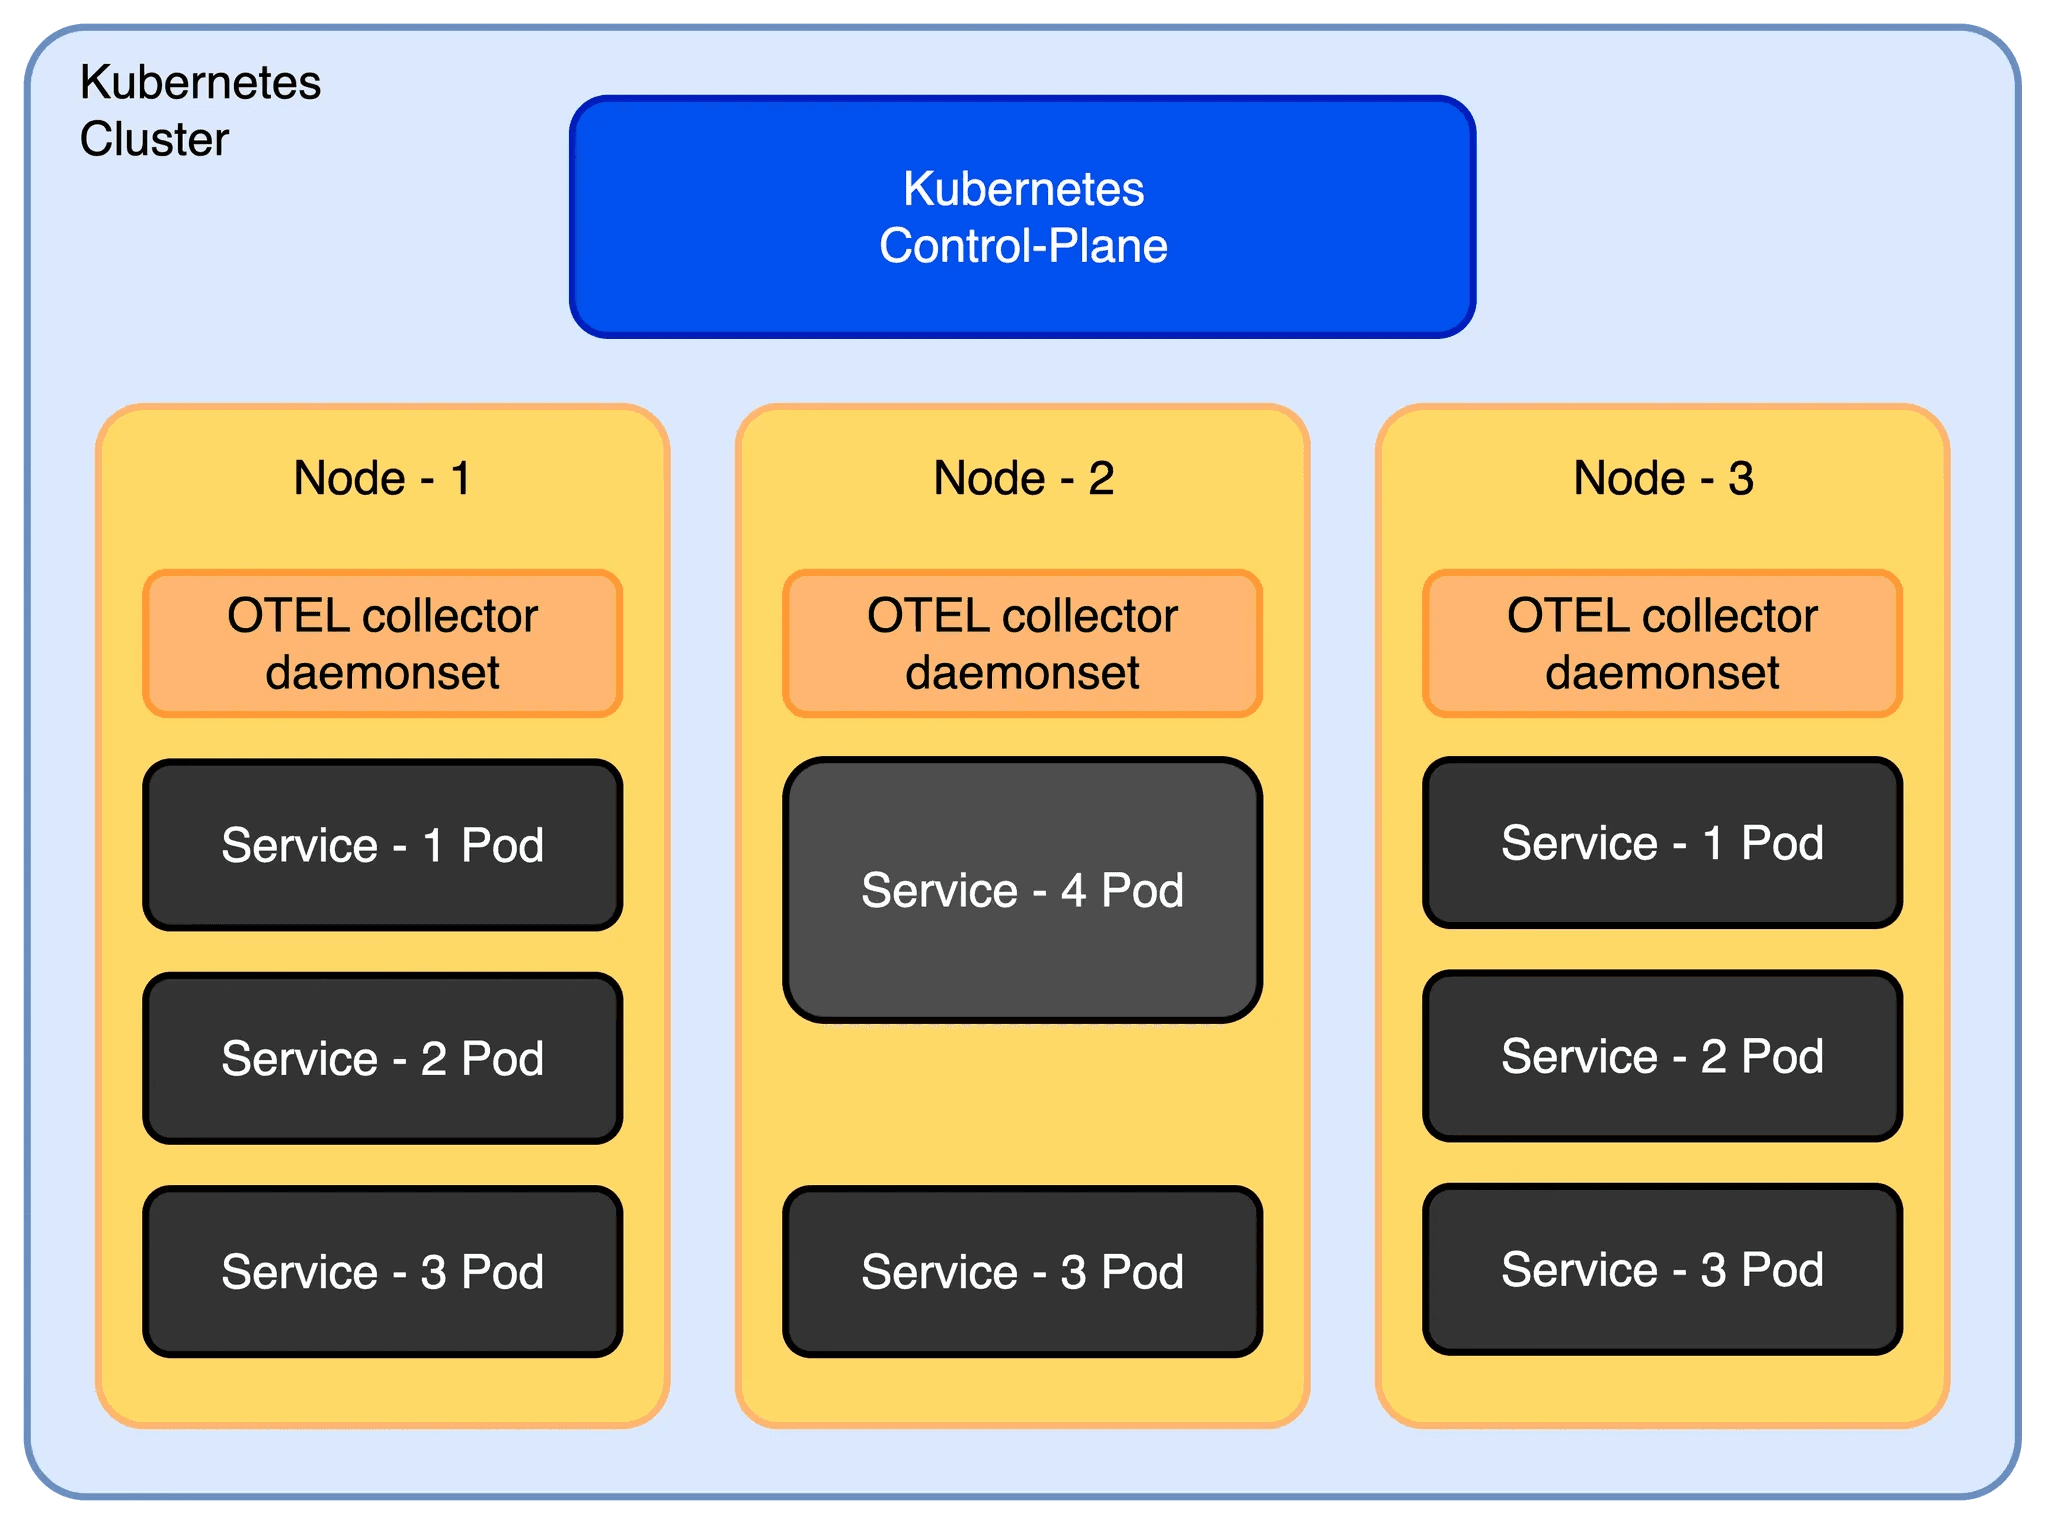
Fig 1: A basic K8s deployment.
Problem 1: Rate limiting hell
Rate Limiting was the first thing I ran into. The collector was sending every single span as an individual HTTP request to the backend. Seemed fine at first. Then during load testing, the backend started throwing 429 errors. Rate limiting. I was losing spans. The issue? Without batching, a collector can easily fire off thousands of requests per second, and no backend is happy about that.
The fix is the batch processor. Add it to the end of your pipeline, right after all your filtering and sampling logic. What it does is instead of sending spans one by one, it buffers them and ships them out in chunks. Simple, but it made a huge difference.
Sample Batch Processor Config:
processors:
  batch:
    timeout: 30s
    send_batch_size: 1000
With this, the collector buffers spans and sends them in bulk (every 30s or 1000 spans), instead of one-by-one. This dramatically cut the number of API calls we made and kept us under quota.
When we placed the batch processor early in the pipeline, it batched all incoming data, logs/spans/metrics that were later dropped. This wasted CPU and memory without preventing rate limits. Moving it to the end of the pipeline (after filtering and sampling) ensured only the final, filtered data was batched and exported.
Problem 2: Memory spikes and collector crashes
A few days into production, we noticed our collector pods were restarting more frequently than expected. I checked the Kubernetes events for the affected pods and saw that they were getting OOMKilled left and right.
Digging deeper, I found that restarts spiked between 1 PM and 3 PM which was the same window when our application traffic peaked.
What happened was the collector was buffering everything it received into memory, and when traffic spiked, boom. Out of memory. The collector went down right when I needed it most.
I fixed it by adding the memory_limiter processor as the very first step in the pipeline.
Sample Memory Limiter Config:
processors:
  memory_limiter:
    check_interval: 5s
    limit_mib: 500
    spike_limit_mib: 100
The processor checks memory usage every 5 seconds. When usage crosses the soft limit (limit_mib - spike_limit_mib), it starts rejecting new data by returning errors to the previous component in the pipeline.
If usage continues to climb and breaches the hard limit ( limit_mib ), it goes a step further , forcing garbage collection to be performed. This gave the collector room to breathe. Instead of crashing, it sheds excess load and recovered quickly.
It's crucial to understand the trade-off: when the memory limiter is triggered, it starts rejecting new data to prevent a crash. This means you will lose telemetry data during traffic spikes. We worked with the application teams to analyze the data volume and tune both the application's telemetry generation and the collector's limits to find a balance between stability and data fidelity.
The memory_limiter processor should be placed first in the pipeline. This ensures that backpressure can reach upstream receivers, minimizing the likelihood of dropped data when memory limits are triggered.
Since the OpenTelemetry Collector is written in Go, we set the GOMEMLIMIT environment variable to align Go’s garbage collector with our limit_mib. This ensures Go’s internal memory management respects the Collector’s configured limits, preventing unexpected memory overflows.
Problem 3: Noisy telemetry from auto-instrumentation
Auto-instrumentation captures everything, including database calls, HTTP requests, and health check pings. While helpful, by default it sends unwanted data without filtering.
Some libraries, like opentelemetry.HTTPInstrumentation, exported detailed metrics for every HTTP request, including health checks. This low-value telemetry data overwhelmed the real signals and increased storage costs.
To fix this use filter processor to drop unwanted data.
Sample Filter Processor Config:
processors:
  filter:
    error_mode: ignore
    traces:
      span:
        - 'IsMatch(attributes["http.route"], ".*/(health|status).*")'
This drops health and status endpoint spans. Result: cleaner traces, lower storage costs. This small change made our traces and metrics far more useful.
Problem 4: Missing Kubernetes metadata
I was getting latency spikes in my backend, but the traces had zero context. Which service? Which pod? Which namespace? It was impossible to debug. I needed to know which Kubernetes node the span came from, which deployment, everything. Without that metadata attached to the spans, I was flying blind.
The solution I found was to use k8sattributes processor to automatically enrich telemetry with Kubernetes metadata.
Sample K8sattriubutes Config:
processors:
  k8sattributes:
    passthrough: false
    auth_type: serviceAccount
    pod_association:
      - sources:
          - from: resource_attribute
            name: k8s.pod.ip
    extract:
      metadata
This attaches metadata like namespace, pod name, and deployment to each span and log. Now every span and log includes fields that make filtering and building dashboards much more powerful.
A word of caution: adding these attributes, especially high-cardinality ones (like k8s.pod.id ,k8s.node.ip ), increases your payload size and can significantly drive up costs, particularly for metrics. Additionally, in environments with autoscaling, a pod ID you see in telemetry data might have already been terminated or scaled in by the time you debug. Be selective about which attributes you attach to which signals to balance observability and cost.
Problem 5: High-volume traces but no signal
This was the big one. At scale, I was generating thousands of traces per minute. Most of them were successful 200-OK requests, boring stuff I didn't need.
But buried in that noise were a few error traces that actually mattered. I couldn't see them. My backend was getting crushed, and I had no way to focus on what actually went wrong.
The solution was to add tail_sampling processor to keep only meaningful traces. Tail sampling waits until a trace is complete before deciding whether to keep it, allowing you to filter based on error status, latency, or other attributes.
Sample Tail Sampling Config: (with what each part actually does)
tail_sampling/traces:
    decision_wait: 20s              # Wait up to 20 seconds for a trace to complete
    num_traces: 2000                # Hold up to 2000 traces in flight at once
    expected_new_traces_per_sec: 100
    decision_cache:
      sampled_cache_size: 100_000   # Remember which traces we sampled
      non_sampled_cache_size: 100_000
    sample_on_first_match: true     # Stop checking once we hit a rule

    policies:
      # Rule 1: Never drop a trace with errors
      - name: keep-error-traces
        type: and
        and:
          and_sub_policy:
            - name: service-name-test
              type: string_attribute
              string_attribute:
                key: service.name
                values:
                  - "api"           # Apply to api service
            - name: status-code-test
              type: status_code
              status_code:
                status_codes:
                  - ERROR           # Any errors at all
            - name: method-match-test
              type: string_attribute
              string_attribute:
                key: http.method
                values:
                  - "GET"
                  - "POST"
                  - "PUT"
                  - "DELETE"
                  - "PATCH"

      # Rule 2: Always keep traces from critical money-moving endpoints
      - name: critical-endpoint-policy
        type: and
        and:
          and_sub_policy:
            - name: path-match-test
              type: string_attribute
              string_attribute:
                key: http.route
                values:
                  - "/payments"     # These matter
                  - "/orders"
                  - "/requests"
            - name: method-match-test
              type: string_attribute
              string_attribute:
                key: http.method
                values:
                  - "POST"          # Only the write operations

      # Rule 3: If it's slow, we want to see it
      - name: latency-policy
        type: latency
        latency:
          threshold_ms: 5000        # Anything taking more than 5 seconds

      # Rule 4: For everything else, just grab a random 10%
      - name: probabilistic-sampling
        type: probabilistic
        probabilistic:
          sampling_percentage: 10   # Good baseline for normal traffic
This setup ensured we:
Always export traces with errors.
Always export traces for critical endpoints.
Export slow requests (latency ≥ 5000ms ).
Randomly sample 10% of all other traces for a baseline.
It's important to recognize that tail sampling is resource intensive. The collector must hold all spans for a trace in memory while it waits for the trace to complete, which increases its compute and memory requirements. The policies are also highly flexible; for instance, you can add rules to filter based on span size, allowing you to drop exceptionally large spans unless they contain an error, further optimizing costs.
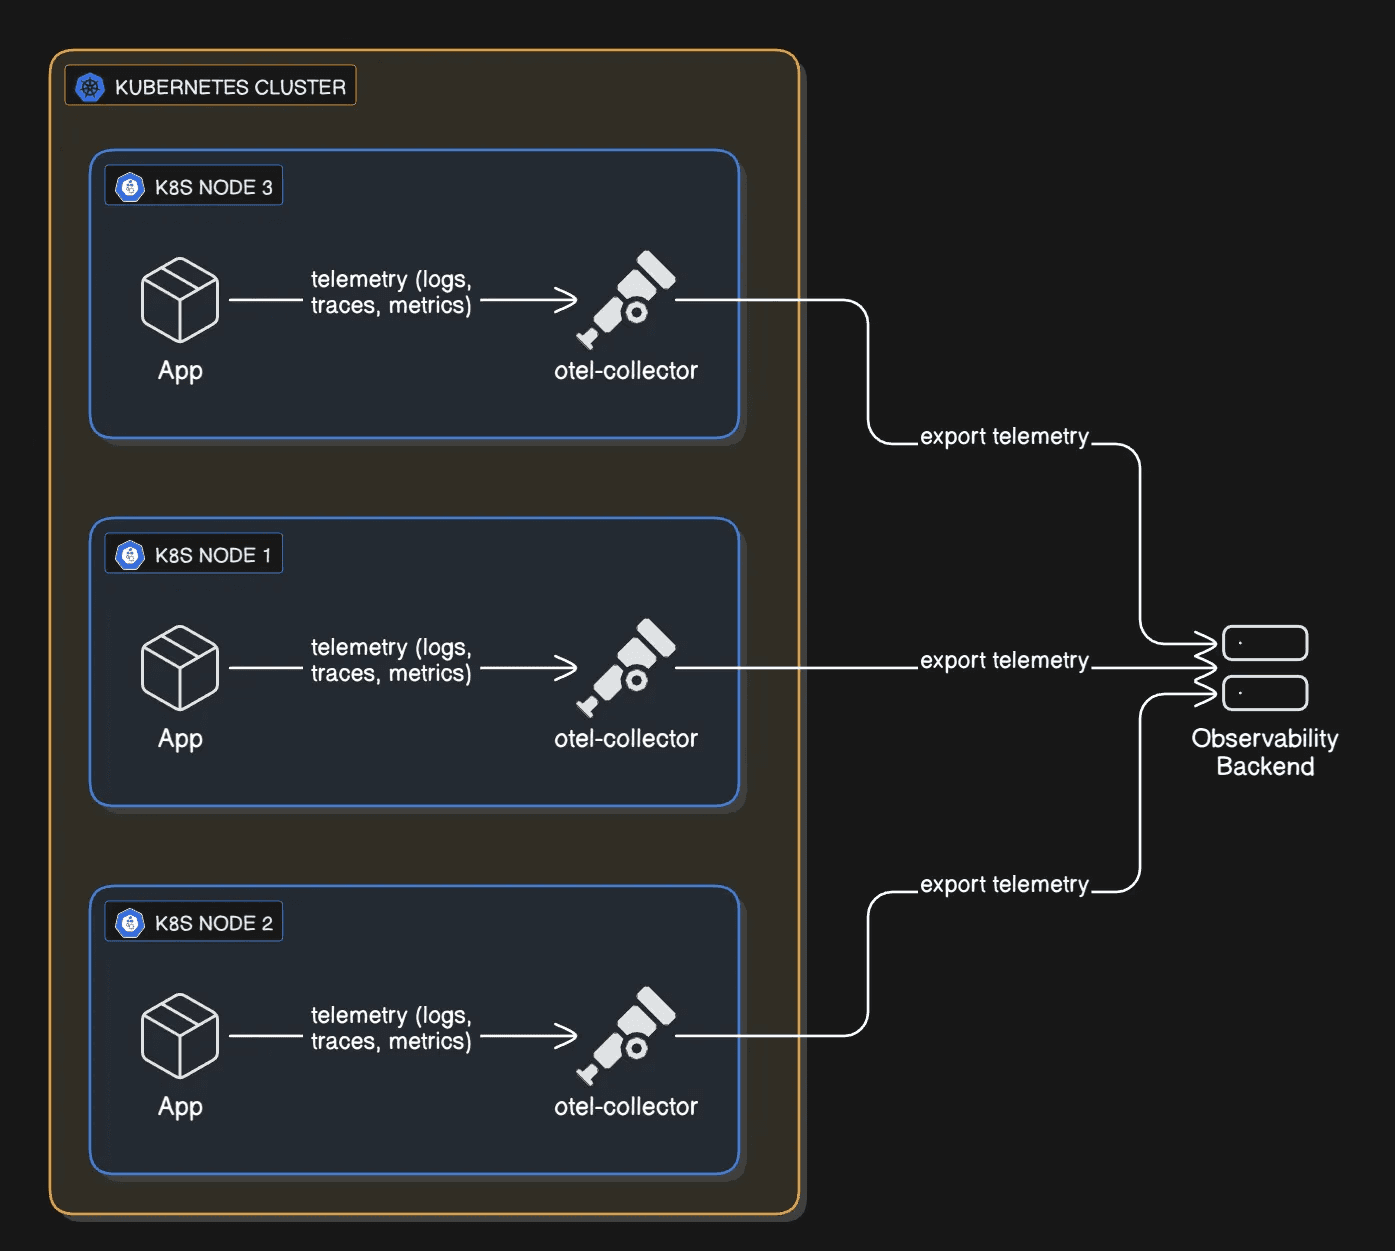
Fig 2: Telemetry Data Flow Diagram.
It worked well. Our trace volume dropped, costs went down, and the signals we cared about were easier to spot.
Problem 6: The Gotcha which lead to a Re-architecture
Everything looked fine until we started noticing something odd. Some traces were incomplete. The root span would be there, but several downstream spans were missing or some traces had root span missing. This made debugging harder, especially for distributed requests that crossed multiple services.
After digging into it, we realized the problem was with tail sampling. It only works when all spans of a trace reach the same collector instance. In our setup, spans were spread across multiple collectors. Each instance was making independent sampling decisions with only partial visibility. As a result, we saw broken traces that told only half the story.
The real fix was setting up distributed enrichment + centralized tail sampling
We redesigned it so all spans from a single trace always land on the same collector instance. We route by trace ID. This way the collector sees the complete picture before deciding what to keep.
Think of it like this: you wouldn't have two judges review halves of the same case separately and each make a conviction decision. You'd have them look at the whole case together. Same idea here.
The Final Architecture: using DaemonSets
Here's the architecture we landed on. We deploy collectors as DaemonSets: basically one collector living on each Kubernetes node, hanging out close to the actual applications.
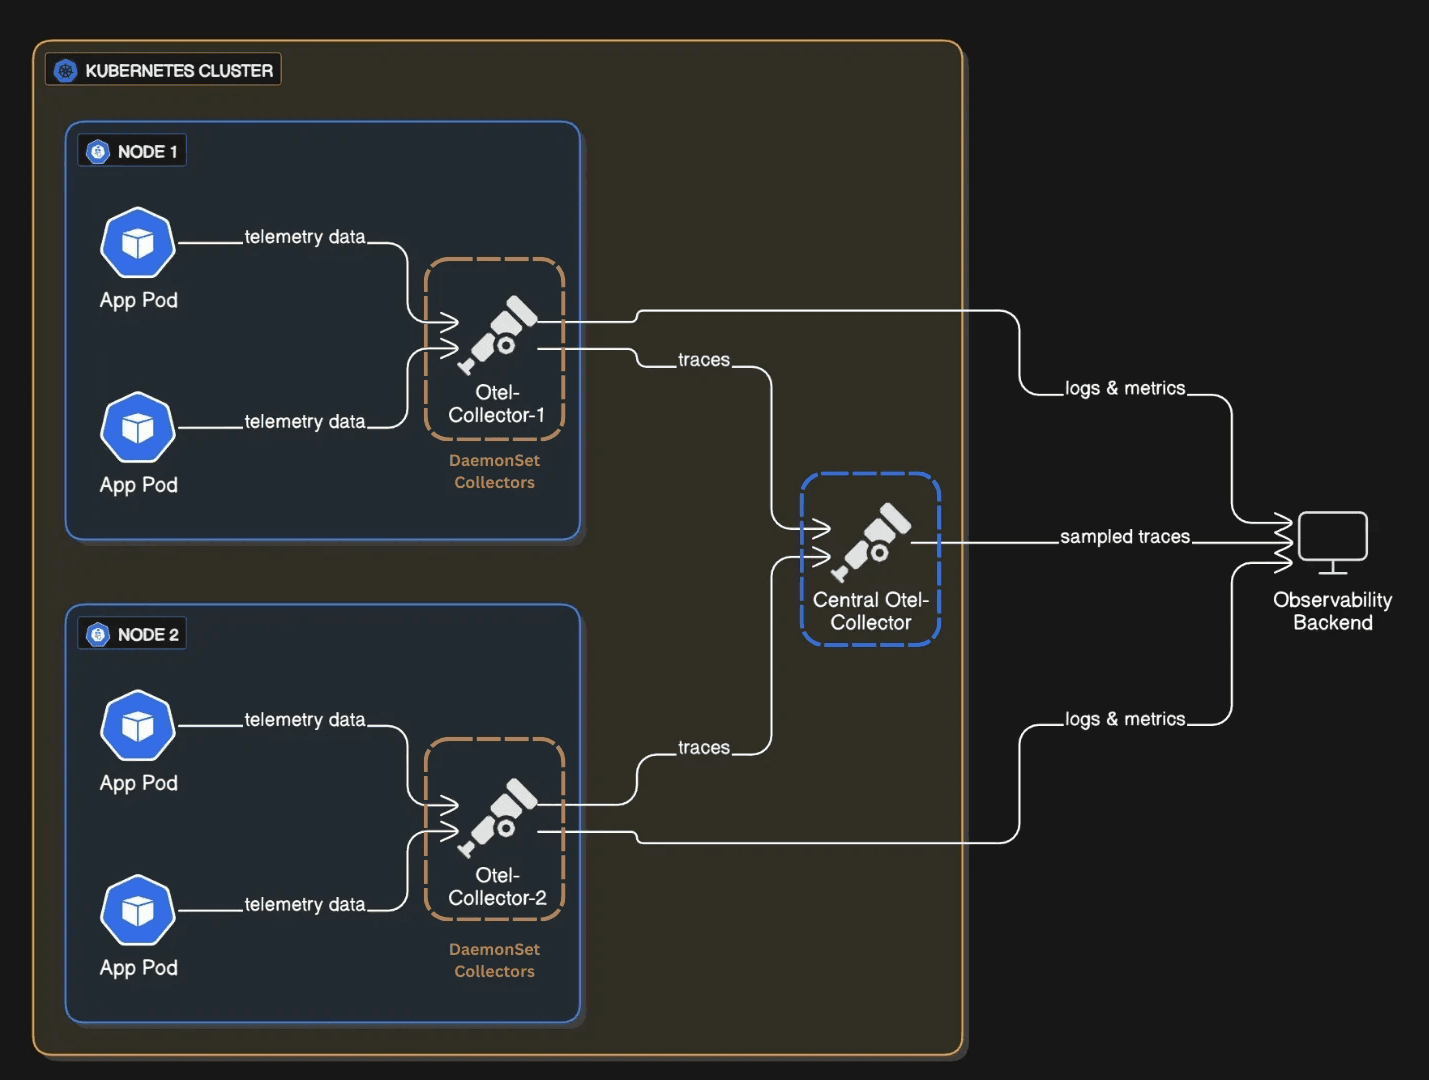
Fig 3: Telemetry Data Flow Diagram after re-architecture.
These DaemonSet collectors do three things:
First, they filter early. Throw away the stuff you don't need. Health check spans, readiness probe logs, liveness probe metrics this is noise. Drop it here, at the source, before it travels across the cluster. This saves network bandwidth, storage, and backend costs immediately.
Second, they enrich with context. Before sending data anywhere, attach Kubernetes metadata: namespace, pod name, deployment, node name. The collector's already on the node, so it has full access to this info. Don't send raw telemetry and add labels later; do it here where the context is fresh and complete.
Third, they route smartly. Logs and metrics go straight to the backend. But traces? Those go to a central collector for the next layer of processing.
One thing to watch:
If you attach fancy high-cardinality attributes like k8s.pod.id or k8s.node.ip to everything, your payload size balloons. In autoscaling clusters, a pod ID you're sending might be dead by the time you look at it. Be selective: not every signal needs every attribute.
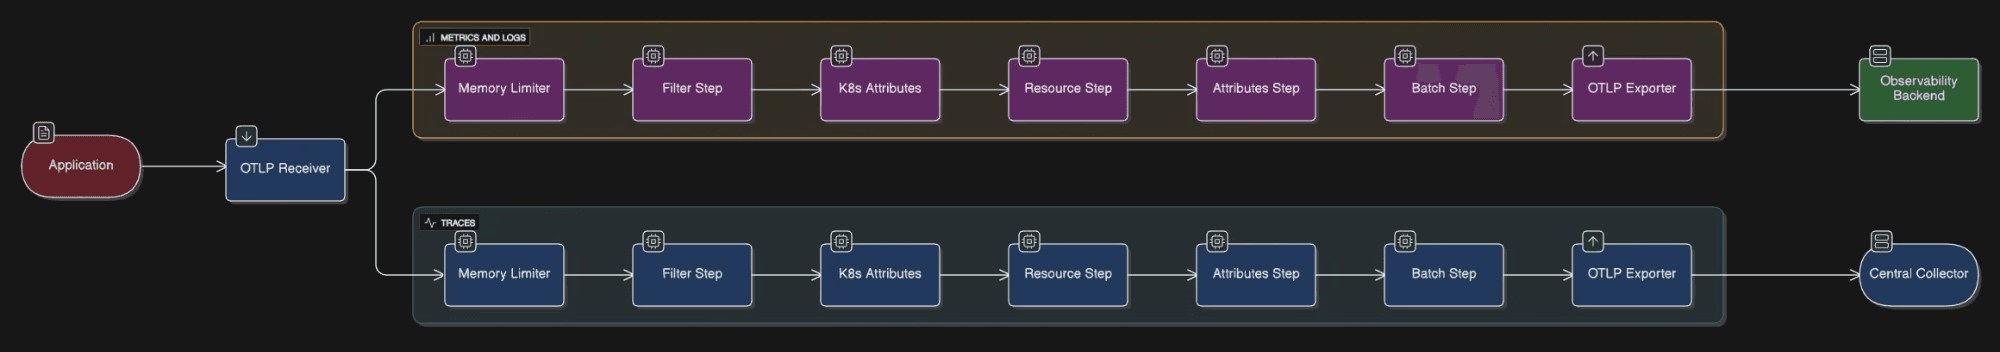
Fig 4: How the data flows in DaemonSet collectors.
Here's the key: traces are routed by trace ID. This means all spans from one request stay together and land on the same central collector. Now the collector can see the whole picture and make smart decisions about tail sampling.
Once a complete trace arrives, the central collector applies the sampling rules we talked about earlier. It keeps errors, critical endpoints, and slow requests. It samples a baseline of normal traffic. Everything else gets dropped.
Why does this setup actually work?
Enrichment and filtering happen at the source, where full pod and Kubernetes context is available. This ensures accurate metadata and removes noisy telemetry early.
Spans are routed by
trace_id, so all spans of a request stay together. This keeps traces complete and easy to analyze.Tail sampling happens centrally after the full trace is collected. This allows smart decisions based on errors and latency.
With this setup, we kept all required metadata while sending only meaningful traces to the backend. Errors and slow requests were always captured, while normal traffic was sampled just enough for coverage. This led to faster incident triage, cleaner dashboards, and much lower ingest volumes.
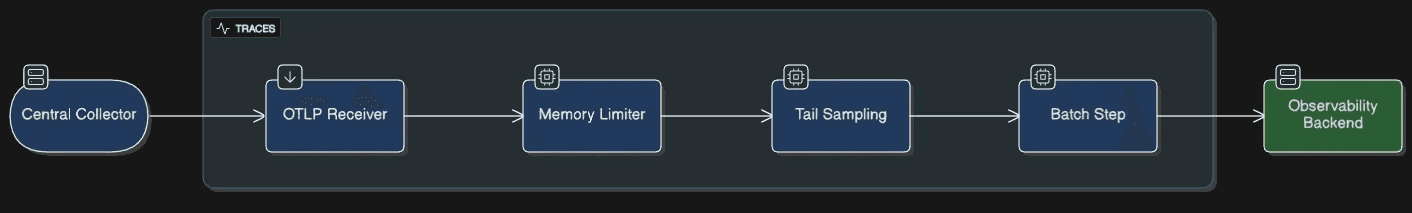
Fig 5: How the data flows in Central collector.
Before you build this, ask yourself
Is my trace volume high enough? If you're sending under 50 traces per second, a single collector is probably fine. This two-tier setup adds complexity. Only worth it if you're drowning in data.
What's my current observability bill looking like? Measure how many GB per day you're sending. Tail sampling usually cuts this by 40–70%. The infrastructure cost of running central collectors is usually worth it if you're paying a lot for ingest.
How fast do I need to debug? During an incident, can I find the right trace in 30 seconds or 5 minutes? If you need blazingly fast incident triage, this architecture gets you there. If incidents are rare and debugging can be slower, maybe overkill.
Does my team know Kubernetes well? This setup means managing DaemonSets, understanding pod routing, tuning memory limits. It's not rocket science but it's not trivial either. Make sure your team's ready.
Conclusion
Here's what I learned the hard way: building observability at scale isn't about the tools or the configuration. It's about understanding your data. How it flows through your system. What matters, what's noise. The two-tier architecture I'm sharing here came from trial and error. It filters out garbage at the edge, enriches data where it makes sense, and makes intelligent decisions about sampling in the center. That's the pattern that actually works.
If you're building observability infrastructure and running into the same issues I did, you don't have to figure it all out from scratch. Use this. It works. If you want to dive deeper into how to make this work at your scale, or talk through the architecture for your specific setup, reach out. We've done this enough times that we can help you skip the painful parts.
In our case, we addressed challenges such as rate limits, noisy telemetry, high trace volumes, and missing metadata by redesigning the collector architecture and choosing the right processors. Moving to a two-tier collector setup allowed us to filter and enrich data at the source, apply intelligent tail sampling centrally, and scale reliably under heavy traffic all while controlling costs and preserving the telemetry data that truly mattered.
The key takeaway is that effective observability depends as much on architecture and data flow as it does on instrumentation. A well designed collector pipeline can be the difference between actionable insights and overwhelming noise or worse, silent failure.
Ready to scale your observability?
Designing a production-ready observability pipeline requires more than just processors it demands careful architectural decisions and deep Kubernetes expertise. At One2N, we help SRE teams and engineering leaders build scalable, cost-effective observability stacks that handle real-world production challenges.
Whether you're struggling with collector crashes, noisy telemetry, or runaway costs, our SRE consulting services can help you design and implement an observability architecture that works.
Schedule a consultation with our SRE team →
Learn more about production observability
This article is part of One2N's practical SRE series. Explore more:
If you've read our post on OpenTelemetry fundamentals, you know that logs, metrics, and traces are the three pillars of observability. But here's what we didn't cover: how to actually make observability work at scale.
When I deployed OpenTelemetry collectors to production, I quickly learned that collecting data is just the first step. The real challenge is handling that data reliably, cost-effectively, and at volume.
This blog tries to address these challenges. Some of the takeaways we would like to focus on are:
How to handle rate limits without losing data
Why collectors crash during traffic spikes and how to prevent it
How to filter noise without dropping important data
How to enrich telemetry with Kubernetes context automatically
Why trace sampling is harder than it seems
How to build a two-tier collector architecture that scales
Fig 1: A basic K8s deployment.
Problem 1: Rate limiting hell
Rate Limiting was the first thing I ran into. The collector was sending every single span as an individual HTTP request to the backend. Seemed fine at first. Then during load testing, the backend started throwing 429 errors. Rate limiting. I was losing spans. The issue? Without batching, a collector can easily fire off thousands of requests per second, and no backend is happy about that.
The fix is the batch processor. Add it to the end of your pipeline, right after all your filtering and sampling logic. What it does is instead of sending spans one by one, it buffers them and ships them out in chunks. Simple, but it made a huge difference.
Sample Batch Processor Config:
processors:
  batch:
    timeout: 30s
    send_batch_size: 1000
With this, the collector buffers spans and sends them in bulk (every 30s or 1000 spans), instead of one-by-one. This dramatically cut the number of API calls we made and kept us under quota.
When we placed the batch processor early in the pipeline, it batched all incoming data, logs/spans/metrics that were later dropped. This wasted CPU and memory without preventing rate limits. Moving it to the end of the pipeline (after filtering and sampling) ensured only the final, filtered data was batched and exported.
Problem 2: Memory spikes and collector crashes
A few days into production, we noticed our collector pods were restarting more frequently than expected. I checked the Kubernetes events for the affected pods and saw that they were getting OOMKilled left and right.
Digging deeper, I found that restarts spiked between 1 PM and 3 PM which was the same window when our application traffic peaked.
What happened was the collector was buffering everything it received into memory, and when traffic spiked, boom. Out of memory. The collector went down right when I needed it most.
I fixed it by adding the memory_limiter processor as the very first step in the pipeline.
Sample Memory Limiter Config:
processors:
  memory_limiter:
    check_interval: 5s
    limit_mib: 500
    spike_limit_mib: 100
The processor checks memory usage every 5 seconds. When usage crosses the soft limit (limit_mib - spike_limit_mib), it starts rejecting new data by returning errors to the previous component in the pipeline.
If usage continues to climb and breaches the hard limit ( limit_mib ), it goes a step further , forcing garbage collection to be performed. This gave the collector room to breathe. Instead of crashing, it sheds excess load and recovered quickly.
It's crucial to understand the trade-off: when the memory limiter is triggered, it starts rejecting new data to prevent a crash. This means you will lose telemetry data during traffic spikes. We worked with the application teams to analyze the data volume and tune both the application's telemetry generation and the collector's limits to find a balance between stability and data fidelity.
The memory_limiter processor should be placed first in the pipeline. This ensures that backpressure can reach upstream receivers, minimizing the likelihood of dropped data when memory limits are triggered.
Since the OpenTelemetry Collector is written in Go, we set the GOMEMLIMIT environment variable to align Go’s garbage collector with our limit_mib. This ensures Go’s internal memory management respects the Collector’s configured limits, preventing unexpected memory overflows.
Problem 3: Noisy telemetry from auto-instrumentation
Auto-instrumentation captures everything, including database calls, HTTP requests, and health check pings. While helpful, by default it sends unwanted data without filtering.
Some libraries, like opentelemetry.HTTPInstrumentation, exported detailed metrics for every HTTP request, including health checks. This low-value telemetry data overwhelmed the real signals and increased storage costs.
To fix this use filter processor to drop unwanted data.
Sample Filter Processor Config:
processors:
  filter:
    error_mode: ignore
    traces:
      span:
        - 'IsMatch(attributes["http.route"], ".*/(health|status).*")'
This drops health and status endpoint spans. Result: cleaner traces, lower storage costs. This small change made our traces and metrics far more useful.
Problem 4: Missing Kubernetes metadata
I was getting latency spikes in my backend, but the traces had zero context. Which service? Which pod? Which namespace? It was impossible to debug. I needed to know which Kubernetes node the span came from, which deployment, everything. Without that metadata attached to the spans, I was flying blind.
The solution I found was to use k8sattributes processor to automatically enrich telemetry with Kubernetes metadata.
Sample K8sattriubutes Config:
processors:
  k8sattributes:
    passthrough: false
    auth_type: serviceAccount
    pod_association:
      - sources:
          - from: resource_attribute
            name: k8s.pod.ip
    extract:
      metadata
This attaches metadata like namespace, pod name, and deployment to each span and log. Now every span and log includes fields that make filtering and building dashboards much more powerful.
A word of caution: adding these attributes, especially high-cardinality ones (like k8s.pod.id ,k8s.node.ip ), increases your payload size and can significantly drive up costs, particularly for metrics. Additionally, in environments with autoscaling, a pod ID you see in telemetry data might have already been terminated or scaled in by the time you debug. Be selective about which attributes you attach to which signals to balance observability and cost.
Problem 5: High-volume traces but no signal
This was the big one. At scale, I was generating thousands of traces per minute. Most of them were successful 200-OK requests, boring stuff I didn't need.
But buried in that noise were a few error traces that actually mattered. I couldn't see them. My backend was getting crushed, and I had no way to focus on what actually went wrong.
The solution was to add tail_sampling processor to keep only meaningful traces. Tail sampling waits until a trace is complete before deciding whether to keep it, allowing you to filter based on error status, latency, or other attributes.
Sample Tail Sampling Config: (with what each part actually does)
tail_sampling/traces:
    decision_wait: 20s              # Wait up to 20 seconds for a trace to complete
    num_traces: 2000                # Hold up to 2000 traces in flight at once
    expected_new_traces_per_sec: 100
    decision_cache:
      sampled_cache_size: 100_000   # Remember which traces we sampled
      non_sampled_cache_size: 100_000
    sample_on_first_match: true     # Stop checking once we hit a rule

    policies:
      # Rule 1: Never drop a trace with errors
      - name: keep-error-traces
        type: and
        and:
          and_sub_policy:
            - name: service-name-test
              type: string_attribute
              string_attribute:
                key: service.name
                values:
                  - "api"           # Apply to api service
            - name: status-code-test
              type: status_code
              status_code:
                status_codes:
                  - ERROR           # Any errors at all
            - name: method-match-test
              type: string_attribute
              string_attribute:
                key: http.method
                values:
                  - "GET"
                  - "POST"
                  - "PUT"
                  - "DELETE"
                  - "PATCH"

      # Rule 2: Always keep traces from critical money-moving endpoints
      - name: critical-endpoint-policy
        type: and
        and:
          and_sub_policy:
            - name: path-match-test
              type: string_attribute
              string_attribute:
                key: http.route
                values:
                  - "/payments"     # These matter
                  - "/orders"
                  - "/requests"
            - name: method-match-test
              type: string_attribute
              string_attribute:
                key: http.method
                values:
                  - "POST"          # Only the write operations

      # Rule 3: If it's slow, we want to see it
      - name: latency-policy
        type: latency
        latency:
          threshold_ms: 5000        # Anything taking more than 5 seconds

      # Rule 4: For everything else, just grab a random 10%
      - name: probabilistic-sampling
        type: probabilistic
        probabilistic:
          sampling_percentage: 10   # Good baseline for normal traffic
This setup ensured we:
Always export traces with errors.
Always export traces for critical endpoints.
Export slow requests (latency ≥ 5000ms ).
Randomly sample 10% of all other traces for a baseline.
It's important to recognize that tail sampling is resource intensive. The collector must hold all spans for a trace in memory while it waits for the trace to complete, which increases its compute and memory requirements. The policies are also highly flexible; for instance, you can add rules to filter based on span size, allowing you to drop exceptionally large spans unless they contain an error, further optimizing costs.
Fig 2: Telemetry Data Flow Diagram.
It worked well. Our trace volume dropped, costs went down, and the signals we cared about were easier to spot.
Problem 6: The Gotcha which lead to a Re-architecture
Everything looked fine until we started noticing something odd. Some traces were incomplete. The root span would be there, but several downstream spans were missing or some traces had root span missing. This made debugging harder, especially for distributed requests that crossed multiple services.
After digging into it, we realized the problem was with tail sampling. It only works when all spans of a trace reach the same collector instance. In our setup, spans were spread across multiple collectors. Each instance was making independent sampling decisions with only partial visibility. As a result, we saw broken traces that told only half the story.
The real fix was setting up distributed enrichment + centralized tail sampling
We redesigned it so all spans from a single trace always land on the same collector instance. We route by trace ID. This way the collector sees the complete picture before deciding what to keep.
Think of it like this: you wouldn't have two judges review halves of the same case separately and each make a conviction decision. You'd have them look at the whole case together. Same idea here.
The Final Architecture: using DaemonSets
Here's the architecture we landed on. We deploy collectors as DaemonSets: basically one collector living on each Kubernetes node, hanging out close to the actual applications.
Fig 3: Telemetry Data Flow Diagram after re-architecture.
These DaemonSet collectors do three things:
First, they filter early. Throw away the stuff you don't need. Health check spans, readiness probe logs, liveness probe metrics this is noise. Drop it here, at the source, before it travels across the cluster. This saves network bandwidth, storage, and backend costs immediately.
Second, they enrich with context. Before sending data anywhere, attach Kubernetes metadata: namespace, pod name, deployment, node name. The collector's already on the node, so it has full access to this info. Don't send raw telemetry and add labels later; do it here where the context is fresh and complete.
Third, they route smartly. Logs and metrics go straight to the backend. But traces? Those go to a central collector for the next layer of processing.
One thing to watch:
If you attach fancy high-cardinality attributes like k8s.pod.id or k8s.node.ip to everything, your payload size balloons. In autoscaling clusters, a pod ID you're sending might be dead by the time you look at it. Be selective: not every signal needs every attribute.
Fig 4: How the data flows in DaemonSet collectors.
Here's the key: traces are routed by trace ID. This means all spans from one request stay together and land on the same central collector. Now the collector can see the whole picture and make smart decisions about tail sampling.
Once a complete trace arrives, the central collector applies the sampling rules we talked about earlier. It keeps errors, critical endpoints, and slow requests. It samples a baseline of normal traffic. Everything else gets dropped.
Why does this setup actually work?
Enrichment and filtering happen at the source, where full pod and Kubernetes context is available. This ensures accurate metadata and removes noisy telemetry early.
Spans are routed by
trace_id, so all spans of a request stay together. This keeps traces complete and easy to analyze.Tail sampling happens centrally after the full trace is collected. This allows smart decisions based on errors and latency.
With this setup, we kept all required metadata while sending only meaningful traces to the backend. Errors and slow requests were always captured, while normal traffic was sampled just enough for coverage. This led to faster incident triage, cleaner dashboards, and much lower ingest volumes.
Fig 5: How the data flows in Central collector.
Before you build this, ask yourself
Is my trace volume high enough? If you're sending under 50 traces per second, a single collector is probably fine. This two-tier setup adds complexity. Only worth it if you're drowning in data.
What's my current observability bill looking like? Measure how many GB per day you're sending. Tail sampling usually cuts this by 40–70%. The infrastructure cost of running central collectors is usually worth it if you're paying a lot for ingest.
How fast do I need to debug? During an incident, can I find the right trace in 30 seconds or 5 minutes? If you need blazingly fast incident triage, this architecture gets you there. If incidents are rare and debugging can be slower, maybe overkill.
Does my team know Kubernetes well? This setup means managing DaemonSets, understanding pod routing, tuning memory limits. It's not rocket science but it's not trivial either. Make sure your team's ready.
Conclusion
Here's what I learned the hard way: building observability at scale isn't about the tools or the configuration. It's about understanding your data. How it flows through your system. What matters, what's noise. The two-tier architecture I'm sharing here came from trial and error. It filters out garbage at the edge, enriches data where it makes sense, and makes intelligent decisions about sampling in the center. That's the pattern that actually works.
If you're building observability infrastructure and running into the same issues I did, you don't have to figure it all out from scratch. Use this. It works. If you want to dive deeper into how to make this work at your scale, or talk through the architecture for your specific setup, reach out. We've done this enough times that we can help you skip the painful parts.
In our case, we addressed challenges such as rate limits, noisy telemetry, high trace volumes, and missing metadata by redesigning the collector architecture and choosing the right processors. Moving to a two-tier collector setup allowed us to filter and enrich data at the source, apply intelligent tail sampling centrally, and scale reliably under heavy traffic all while controlling costs and preserving the telemetry data that truly mattered.
The key takeaway is that effective observability depends as much on architecture and data flow as it does on instrumentation. A well designed collector pipeline can be the difference between actionable insights and overwhelming noise or worse, silent failure.
Ready to scale your observability?
Designing a production-ready observability pipeline requires more than just processors it demands careful architectural decisions and deep Kubernetes expertise. At One2N, we help SRE teams and engineering leaders build scalable, cost-effective observability stacks that handle real-world production challenges.
Whether you're struggling with collector crashes, noisy telemetry, or runaway costs, our SRE consulting services can help you design and implement an observability architecture that works.
Schedule a consultation with our SRE team →
Learn more about production observability
This article is part of One2N's practical SRE series. Explore more:
In this post
In this post
Section
Share
Share
In this post
section
Share
Keywords
OpenTelemetry, OTEL Collector, observability, Kubernetes, telemetry, SRE, batch processor, memory limit, filter processor, tail sampling, k8s attributes, real-world tips, cloud-native, One2N blog