Introduction: why error budgets matter in reliability
Every reliability conversation eventually runs into the same wall: “How reliable is reliable enough?” If you ask a product manager, they might say “as close to 100% as possible.” If you ask finance, they will demand lower cloud spend. If you ask engineers, they will want fewer 2 a.m. pages.
Error budgets are how SREs bring order to this chaos. They define the exact amount of unreliability you are allowed, based on your Service Level Objectives (SLOs). An SLO of 99.9% means you have a 0.1% error budget, about 43 minutes of downtime in a month. That number is not abstract. It tells you how much change, risk, and innovation your system can tolerate.
At One2N, we frame error budgets as the currency of reliability. Teams spend it every time there is downtime. If they run out, they stop shipping and focus on stability. This makes reliability a shared responsibility, not an endless demand on engineers.
Step 1: understanding SLOs and error budgets
A Service Level Objective (SLO) is a reliability target expressed as a percentage, such as 99.9 percent uptime over 30 days. The error budget is simply the inverse.

From there, convert the percentage into real time:

For a 30-day month, there are 43,200 minutes. Multiply the error budget percentage by that number.
99.9% uptime = 0.1% downtime = 43 minutes
99.95% uptime = 0.05% downtime = 21 minutes 54 seconds
99.99% uptime = 0.01% downtime = 4 minutes 23 seconds
This conversion step is what wakes people up. Percentages feel abstract. Minutes feel real.
Step 2: converting error budgets into minutes
The simplest way to make error budgets real is to convert them into downtime minutes per month or per year.
SLO | Allowed downtime per month | Allowed downtime per year |
|---|---|---|
99.0% | ~7h 18m | ~3d 15h |
99.5% | ~3h 39m | ~1d 19h |
99.9% | ~43m | ~8h 45m |
99.95% | ~21m 54s | ~4h 22m |
99.99% | ~4m 23s | ~52m |
99.999% | ~26s | ~5m 15s |
This table is the reality check. Many leaders casually demand “five nines” without realising it means fewer than five minutes of downtime per year. Unless you are running a global cloud or a financial exchange, this is rarely practical. This table is the rebuttal. You can say: “That means fewer than five minutes of downtime per year. Do you want us to freeze releases and staff a 24/7 war room? Because that’s the cost.”
Step 3: visualizing error budgets
Error budget: downtime minutes vs SLO target
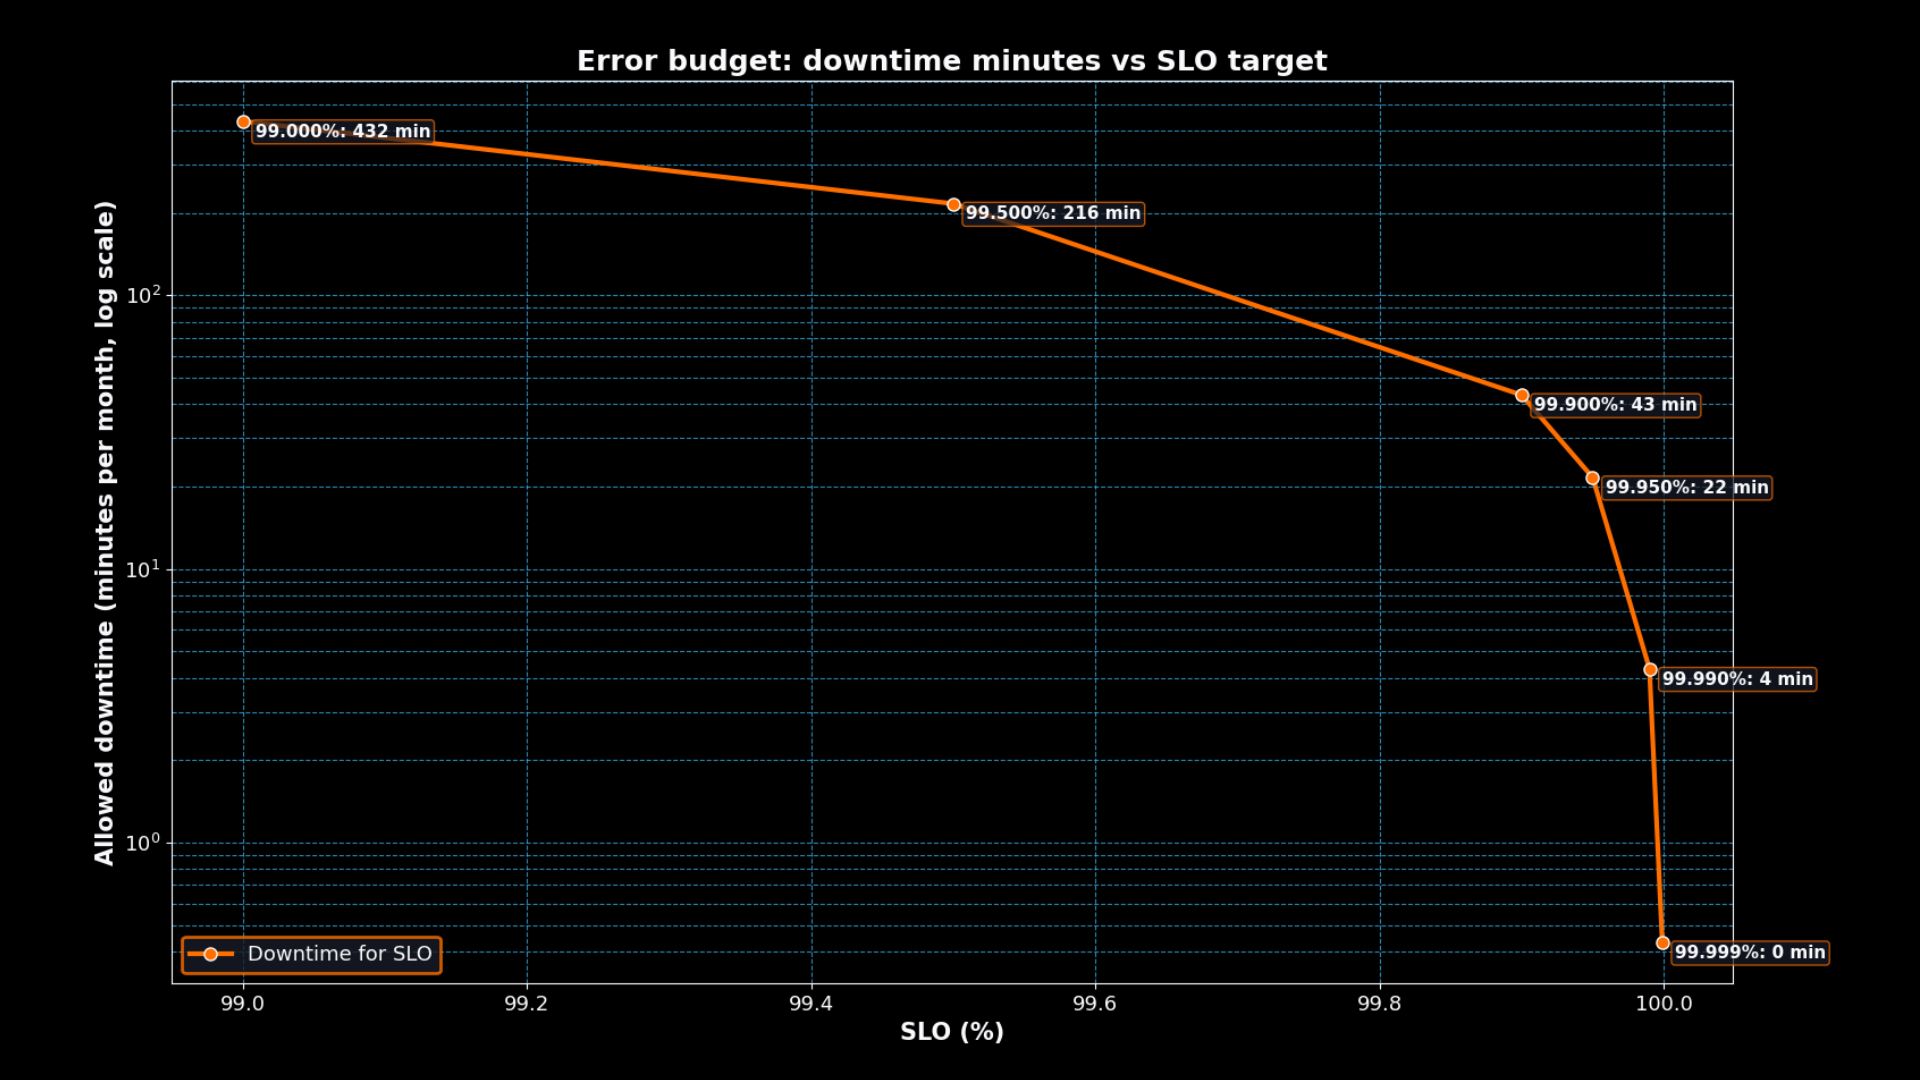
The log-scale graph highlights the steep drop. Moving from 99.9% to 99.99% uptime reduces the monthly error budget from ~43 minutes to just over 4 minutes. Each extra “nine” is a huge jump in cost and complexity for very little additional allowance.
Worked examples of error budgets in action
Example 1: E-commerce Checkout at 99.9%
A retailer sets 99.9% uptime. That means they can afford 43 minutes of downtime per month. If checkout fails for 20 minutes during a Black Friday peak, they just burned nearly half the budget in a single incident. Engineers must then slow down further releases until stability is regained.
Example 2: Internal HR Tool at 99.5%
An HR portal has a 99.5% SLO. That’s 3h 39m per month. Occasional slowdowns during payroll runs are acceptable. Here, reliability demands are lower, so the team can iterate faster with fewer controls.
Example 3: Online Banking App at 99.99%
A bank insists on 99.99% uptime. That’s only 4 minutes 23 seconds per month. Even a single database failover that takes 10 minutes blows the budget. This means engineers must have hot failovers, chaos drills, and instant rollback paths. The SLO drives architecture investment.
This is the balance SRE teams bring to product discussions. Reliability and velocity are two sides of the same budget.
Burn rate and how fast you spend the budget
Error budgets are not just totals, the rate at which you burn them matters.
Slow burn: A handful of minor incidents over the month. Manageable.
Fast burn: Half the budget gone in the first week. Urgent pause on deployments.
Continuous burn: Every day chips away at the budget. Indicates systemic issues, not one-offs.
You can calculate burn rate as:

If burn rate > 1 within a short window, you are overspending. Tools like Datadog and Prometheus can graph error budget burn in real time.
Common pitfalls in using error budgets
Unrealistic SLOs: Choosing “five nines” without the engineering resources to support it. This leads to constant breaches.
Ignoring burn rate: It is not enough to check uptime at the end of the month. Teams need to track how quickly they are burning the budget day by day.
Mixing metrics: An error budget should align with user-facing experience, not just infrastructure metrics. For example, a 200 ms API SLO is useless if checkout still fails half the time.
No enforcement: An error budget only works if breaches trigger action. Without tying it to release velocity, it is just a number on a dashboard.
Putting it all together
Error budgets make reliability concrete. Instead of vague promises, they tell you exactly how much downtime is acceptable: 43 minutes at 99.9%, 4 minutes at 99.99%, 26 seconds at 99.999%.
For SRE managers and engineering leads, this becomes the negotiation tool with product teams. Do you want five nines? Then accept that releases will slow, costs will rise, and tolerance for change will shrink. Do you want faster iteration? Then accept a looser SLO and a larger error budget.
At One2N, we encourage every team to calculate and publish their error budgets alongside SLOs. It keeps expectations clear, aligns engineers with business goals, and provides a defensible basis for reliability decisions.
Internal links:
Introduction: why error budgets matter in reliability
Every reliability conversation eventually runs into the same wall: “How reliable is reliable enough?” If you ask a product manager, they might say “as close to 100% as possible.” If you ask finance, they will demand lower cloud spend. If you ask engineers, they will want fewer 2 a.m. pages.
Error budgets are how SREs bring order to this chaos. They define the exact amount of unreliability you are allowed, based on your Service Level Objectives (SLOs). An SLO of 99.9% means you have a 0.1% error budget, about 43 minutes of downtime in a month. That number is not abstract. It tells you how much change, risk, and innovation your system can tolerate.
At One2N, we frame error budgets as the currency of reliability. Teams spend it every time there is downtime. If they run out, they stop shipping and focus on stability. This makes reliability a shared responsibility, not an endless demand on engineers.
Step 1: understanding SLOs and error budgets
A Service Level Objective (SLO) is a reliability target expressed as a percentage, such as 99.9 percent uptime over 30 days. The error budget is simply the inverse.
From there, convert the percentage into real time:
For a 30-day month, there are 43,200 minutes. Multiply the error budget percentage by that number.
99.9% uptime = 0.1% downtime = 43 minutes
99.95% uptime = 0.05% downtime = 21 minutes 54 seconds
99.99% uptime = 0.01% downtime = 4 minutes 23 seconds
This conversion step is what wakes people up. Percentages feel abstract. Minutes feel real.
Step 2: converting error budgets into minutes
The simplest way to make error budgets real is to convert them into downtime minutes per month or per year.
SLO | Allowed downtime per month | Allowed downtime per year |
|---|---|---|
99.0% | ~7h 18m | ~3d 15h |
99.5% | ~3h 39m | ~1d 19h |
99.9% | ~43m | ~8h 45m |
99.95% | ~21m 54s | ~4h 22m |
99.99% | ~4m 23s | ~52m |
99.999% | ~26s | ~5m 15s |
This table is the reality check. Many leaders casually demand “five nines” without realising it means fewer than five minutes of downtime per year. Unless you are running a global cloud or a financial exchange, this is rarely practical. This table is the rebuttal. You can say: “That means fewer than five minutes of downtime per year. Do you want us to freeze releases and staff a 24/7 war room? Because that’s the cost.”
Step 3: visualizing error budgets
Error budget: downtime minutes vs SLO target
The log-scale graph highlights the steep drop. Moving from 99.9% to 99.99% uptime reduces the monthly error budget from ~43 minutes to just over 4 minutes. Each extra “nine” is a huge jump in cost and complexity for very little additional allowance.
Worked examples of error budgets in action
Example 1: E-commerce Checkout at 99.9%
A retailer sets 99.9% uptime. That means they can afford 43 minutes of downtime per month. If checkout fails for 20 minutes during a Black Friday peak, they just burned nearly half the budget in a single incident. Engineers must then slow down further releases until stability is regained.
Example 2: Internal HR Tool at 99.5%
An HR portal has a 99.5% SLO. That’s 3h 39m per month. Occasional slowdowns during payroll runs are acceptable. Here, reliability demands are lower, so the team can iterate faster with fewer controls.
Example 3: Online Banking App at 99.99%
A bank insists on 99.99% uptime. That’s only 4 minutes 23 seconds per month. Even a single database failover that takes 10 minutes blows the budget. This means engineers must have hot failovers, chaos drills, and instant rollback paths. The SLO drives architecture investment.
This is the balance SRE teams bring to product discussions. Reliability and velocity are two sides of the same budget.
Burn rate and how fast you spend the budget
Error budgets are not just totals, the rate at which you burn them matters.
Slow burn: A handful of minor incidents over the month. Manageable.
Fast burn: Half the budget gone in the first week. Urgent pause on deployments.
Continuous burn: Every day chips away at the budget. Indicates systemic issues, not one-offs.
You can calculate burn rate as:
If burn rate > 1 within a short window, you are overspending. Tools like Datadog and Prometheus can graph error budget burn in real time.
Common pitfalls in using error budgets
Unrealistic SLOs: Choosing “five nines” without the engineering resources to support it. This leads to constant breaches.
Ignoring burn rate: It is not enough to check uptime at the end of the month. Teams need to track how quickly they are burning the budget day by day.
Mixing metrics: An error budget should align with user-facing experience, not just infrastructure metrics. For example, a 200 ms API SLO is useless if checkout still fails half the time.
No enforcement: An error budget only works if breaches trigger action. Without tying it to release velocity, it is just a number on a dashboard.
Putting it all together
Error budgets make reliability concrete. Instead of vague promises, they tell you exactly how much downtime is acceptable: 43 minutes at 99.9%, 4 minutes at 99.99%, 26 seconds at 99.999%.
For SRE managers and engineering leads, this becomes the negotiation tool with product teams. Do you want five nines? Then accept that releases will slow, costs will rise, and tolerance for change will shrink. Do you want faster iteration? Then accept a looser SLO and a larger error budget.
At One2N, we encourage every team to calculate and publish their error budgets alongside SLOs. It keeps expectations clear, aligns engineers with business goals, and provides a defensible basis for reliability decisions.
Internal links: