In Part 1 of the series "Deploying a Scalable NATS Cluster: Core Architecture and Considerations,” we learned about the foundational principles for designing a robust NATS.io deployment. Such as how to right-size a cluster, why we tag servers to keep busy nodes apart, the role of a Dead Letter Queue (DLQ) in resilient systems, and essential configurations like maximum payload size and the Go garbage collector's memory limit (GOMEMLIMIT).
In Part 2, we will do a hands-on demo based on the theoretical groundwork where we will construct a complete, production-grade, and fully observable 4-node NATS cluster using Docker:
create a four node cluster
add Prometheus and Grafana
push real traffic with the
nats benchto prove the sizing rules from Part 1.write a short Go program that interacts with NATS.
troubleshoot critical problems related to NATS
If you want to follow along, the companion git repo for the blog can be found here: https://github.com/d-cryptic/scalable-nats-blog-part-2
The anatomy of our resilient NATS cluster
1. Cluster configuration
server_name=nats-1 # e.g. nats-1, nats-2, nats-3, nats-dlq
listen=4222
jetstream {
    store_dir: /data/jetstream
    max_mem: 1G
    max_file: 5G
}
max_payload: 8M
http_port: 8222
server_tags: ["main"]

# set the below options to true only if needed
# debug: true
# trace: true

logtime: true
logfile_size_limit: 10M
log_file: "/tmp/nats-server.log"

accounts: {
    $SYS: {
        users: [
            {user: sys, password: sys_password}

        ]
    },
    JETSTREAM: {
        jetstream: true
        users: [
            {user: jetstream, password: jetstream_password}
        ]
    }

}

cluster {
  name: nats-cluster-demo # e.g. nats-cluster-region-1
  listen: 0.0.0.0:6222
  routes
Nodes:
3 Main Nodes: Form the core cluster with JetStream replication and quorum consensus.
1 DLQ Node: Handles Dead Letter Queue functionality, managing undelivered or problematic messages separately.
Tagging: Main nodes share the tag
main, while the DLQ node is taggeddlq.JetStream: Enabled with a replication factor of 3 for resilience.
2. Docker compose configuration
version: '3.8'

services:
  nats-1:
    image: nats:latest
    container_name: nats-1
    command: -c /etc/nats/nats-server.conf
    volumes:
      - ./nats-server-1.conf:/etc/nats/nats-server.conf
      - ./data/nats-1:/data/jetstream
      - ./nats-1.log:/tmp/nats-server.log
    ports:
      - 4222:4222
    networks:
      - nats_network
    environment:
     - GOMEMLIMIT=500MiB

  nats-2:
    image: nats:latest
    container_name: nats-2
    command: -c /etc/nats/nats-server.conf
    volumes:
      - ./nats-server-2.conf:/etc/nats/nats-server.conf
      - ./data/nats-2:/data/jetstream
      - ./nats-2.log:/tmp/nats-server.log
    ports:
      - 4223:4222
    networks:
      - nats_network
    environment:
      - GOMEMLIMIT=500MiB

  nats-3:
    image: nats:latest
    container_name: nats-3
    command: -c /etc/nats/nats-server.conf
    volumes:
      - ./nats-server-3.conf:/etc/nats/nats-server.conf
      - ./data/nats-3:/data/jetstream
      - ./nats-3.log:/tmp/nats-server.log
    ports:
      - 4224:4222
    networks:
      - nats_network
    environment:
      - GOMEMLIMIT=500MiB

  nats-dlq:
    image: nats:latest
    container_name: nats-dlq
    command: -c /etc/nats/nats-server.conf
    volumes:
      - ./nats-server-dlq.conf:/etc/nats/nats-server.conf
      - ./data/nats-dlq:/data/jetstream
      - ./nats-dlq.log:/tmp/nats-server.log
    ports:
      - 4225:4222
    networks:
      - nats_network
    environment:
      - GOMEMLIMIT=500MiB

  nats-exporter:
    image: natsio/prometheus-nats-exporter:latest
    container_name: nats-exporter
    command: "-use_internal_server_name -l /tmp/prometheus-nats-exporter.log -p 7778 -varz -subz -routez -leafz -jsz all -healthz -gatewayz -accstatz -connz_detailed <http://nats-1:8222>"
    ports:
      - "7778:7778"
    networks:
      - nats_network
    depends_on:
      - nats-1
      - nats-2
      - nats-3
      - nats-dlq

  prometheus:
    image: prom/prometheus:latest
    container_name: prometheus
    volumes:
      - ./prometheus.yml:/etc/prometheus/prometheus.yml
      - prometheus_data:/prometheus
    ports:
      - "9090:9090"
    networks:
      - nats_network
    depends_on:
      - nats-exporter

  grafana:
    image: grafana/grafana:latest
    container_name: grafana
    ports:
      - "3000:3000"
    volumes:
      - grafana_data:/var/lib/grafana
    networks:
      - nats_network
    depends_on:
      - prometheus

volumes:
  prometheus_data:
  grafana_data:

networks:
  nats_network:
    driver
We use Docker compose for seamless setup:
Each NATS server is individually configurable via separate config files.
All nodes communicate over an internal Docker network (
nats_network).Persistent volumes ensure message durability.
3. Integrated Monitoring
Prometheus collects metrics from all NATS nodes via the
nats-prometheus-exporter.Grafana provides insightful dashboards visualizing metrics, helping quickly identify bottlenecks and performance issues.
Go client code to interact with cluster
Use the following Go example to interact with the NATS cluster, publish messages, handle message acknowledgments, and process DLQ scenarios:
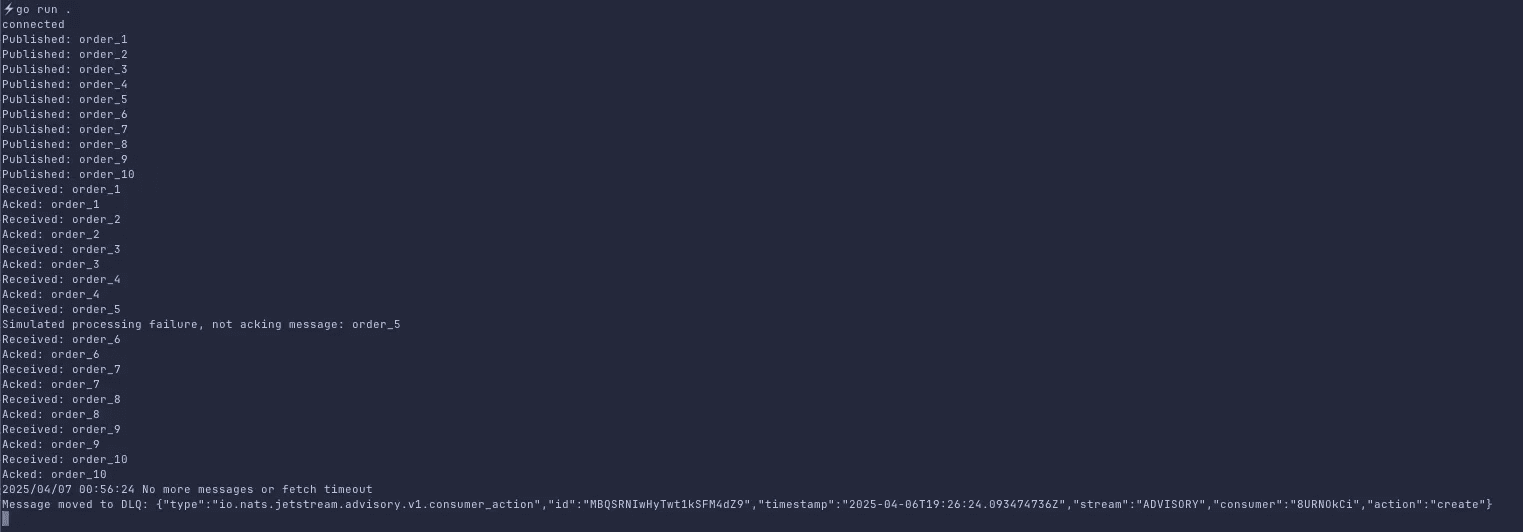
package main

import (
	"fmt"
	"log"
	"time"

	"github.com/nats-io/nats.go"
)

func main() {
	nats_conn_string := "nats://jetstream:jetstream_password@localhost:4222, nats://jetstream:jetstream_password@localhost:4223, nats://jetstream:jetstream_password@localhost:4224, nats://jetstream:jetstream_password@localhost:4225"

	// Connect to nats cluster
	nc, err := nats.Connect(nats_conn_string)
	if err != nil {
		log.Fatal(err)
	}
	defer nc.Drain()
	fmt.Println("connected")

	js, err := nc.JetStream()
	if err != nil {
		log.Fatal(err)
	}

	// Create a stream for main messages
	_, err = js.AddStream(&nats.StreamConfig{
		Name:     "ORDERS",
		Subjects: []string{"orders.*"},
		Replicas: 3,
	})

  if err != nil {
    log.Printf("Stream already exists or error: %v", err)
  }

  // Create DLQ stream for failed messages
  _, err = js.AddStream(&nats.StreamConfig{
    Name: "DLQ",
    Subjects: []string{"dlq.orders"},
    Replicas: 1,
  })
  if err != nil {
    log.Printf("DLQ Stream already exists or error: %v", err)
  }

  // Advisory stream (important!)
  js.AddStream(&nats.StreamConfig{
    Name:      "ADVISORY",
    Subjects:  []string{"$JS.EVENT.ADVISORY.>"},
    Storage:   nats.FileStorage,
    Retention: nats.InterestPolicy,
    Replicas:  1,
  })

  // Publish messages
  for i := 1; i <= 10; i++ {
    msg := fmt.Sprintf("order_%d", i)
    _, err := js.Publish("orders.new", []byte(msg))
    if err != nil {
      log.Printf("Publish error: %v", err)
    } else {
      fmt.Printf("Published: %s\\n", msg)
    }
  }

  // Create a consumer with max delivery attempts
  _, err = js.AddConsumer("ORDERS", &nats.ConsumerConfig{
    Durable: "order-processor",
    AckPolicy: nats.AckExplicitPolicy,
    DeliverPolicy: nats.DeliverAllPolicy,
    MaxDeliver: 3,
  })
  if err != nil {
    log.Printf("Consumer already exists or error: %v", err)
  }

  // Subscribe to consumer and simulate failure for DLQ
  _, err = js.PullSubscribe("orders.*", "order-processor")
  if err != nil {
    log.Fatal(err)
  }

  // Simulate consumer handling with forced failure
  sub, err := js.PullSubscribe("orders.*", "order-processor")
  if err != nil {
    log.Fatal(err)
  }

  for {
    msgs, err := sub.Fetch(5, nats.MaxWait(2*time.Second))
    if err != nil {
      log.Println("No more messages or fetch timeout")
      break
    }

    for _, msg := range msgs {
      fmt.Printf("Received: %s\\n", string(msg.Data))
      //Simulate processing failure
      if string(msg.Data) == "order_5" {
        fmt.Println("Simulated processing failure, not acking message:", string(msg.Data))
        continue
      }
      msg.Ack()
      fmt.Println("Acked:", string(msg.Data))
    }
  }

  //DLQ handling: Subscribe to Advisories and move message to DLQ Stream
  _, err = js.Subscribe("$JS.EVENT.ADVISORY.CONSUMER.*.*.*", func(m *nats.Msg) {
    metadata, err := m.Metadata()
    if err != nil {
      log.Println("Metadata error:", err)
      return
    }
    stream := metadata.Stream
    seq := metadata.Sequence.Stream

    // Fetch original message
    orgMsg, err := js.GetMsg(stream, seq)
    if err != nil {
      log.Println("Failed to get original message", err)
      return
    }

    // Publish to DLQ stream
    _, err = js.Publish("dlq.orders", orgMsg.Data)
    if err != nil {
      log.Println("Failed to publish to DLQ:",err)
    } else {
      fmt.Println("Message moved to DLQ:", string(orgMsg.Data))
    }
  })

  if err != nil {
    fmt.Println("here")
    log.Fatal(err)
  }

  // Keep application running
  select
Running the Demo:
Start the entire environment with one command:
docker-compose up -dPrometheus UI: Access metrics at http://localhost:9090.
Grafana UI: Visual dashboards available at http://localhost:3000.
Default credentials:
admin/admin.Import the official NATS JetStream dashboard (Dashboard ID:
12767) for comprehensive visualization.
nats context add nats-one2n-test --server nats://jetstream:jetstream_password@localhost:4222 --description "NATS One2n Demo" --select
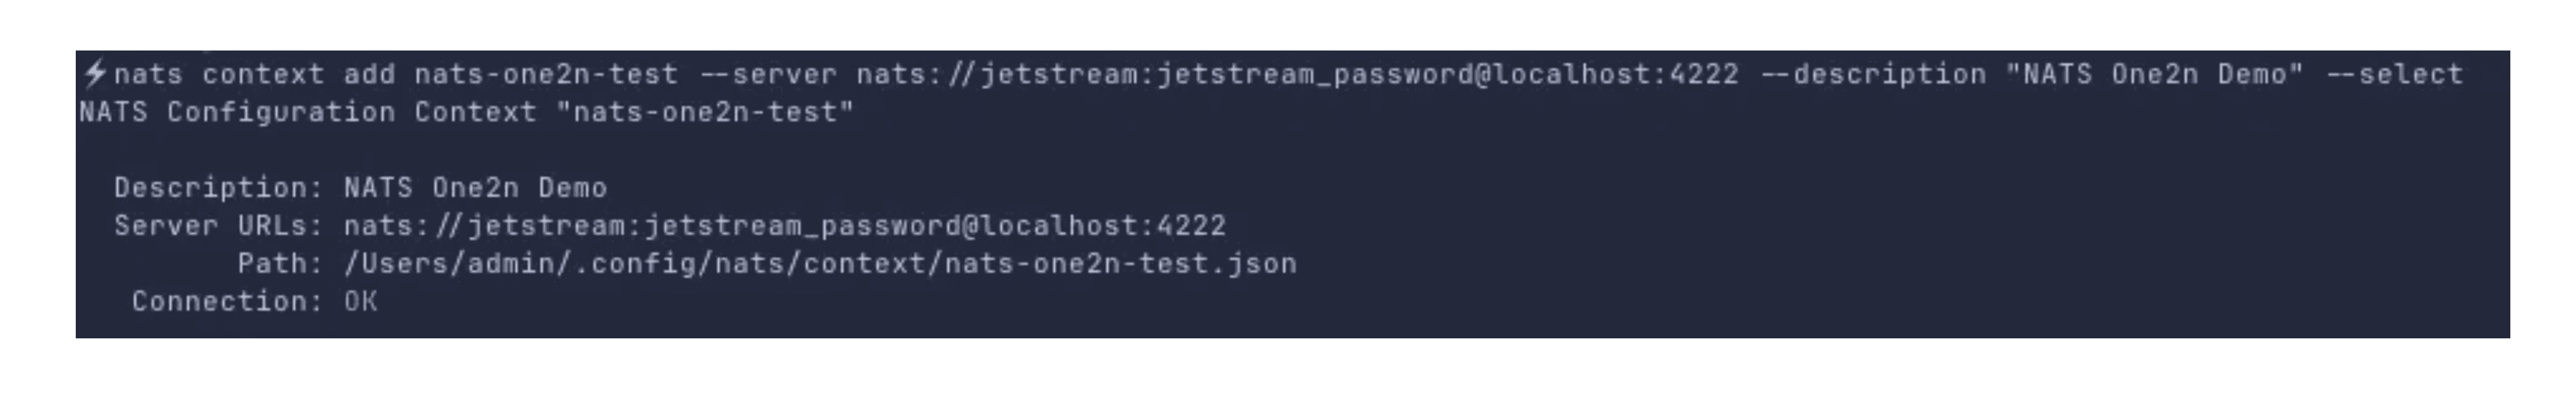
This command will add a context to the NATS CLI which will help us to interact with our NATS Cluster

No streams are present. This is because we have to create streams with our required config either via code or via NATS CLI.
We will use Go Code to interact with our NATS cluster
go mod init nats-consumer-one2n-demo
go get github.com/nats-io/nats.go # install nats go client
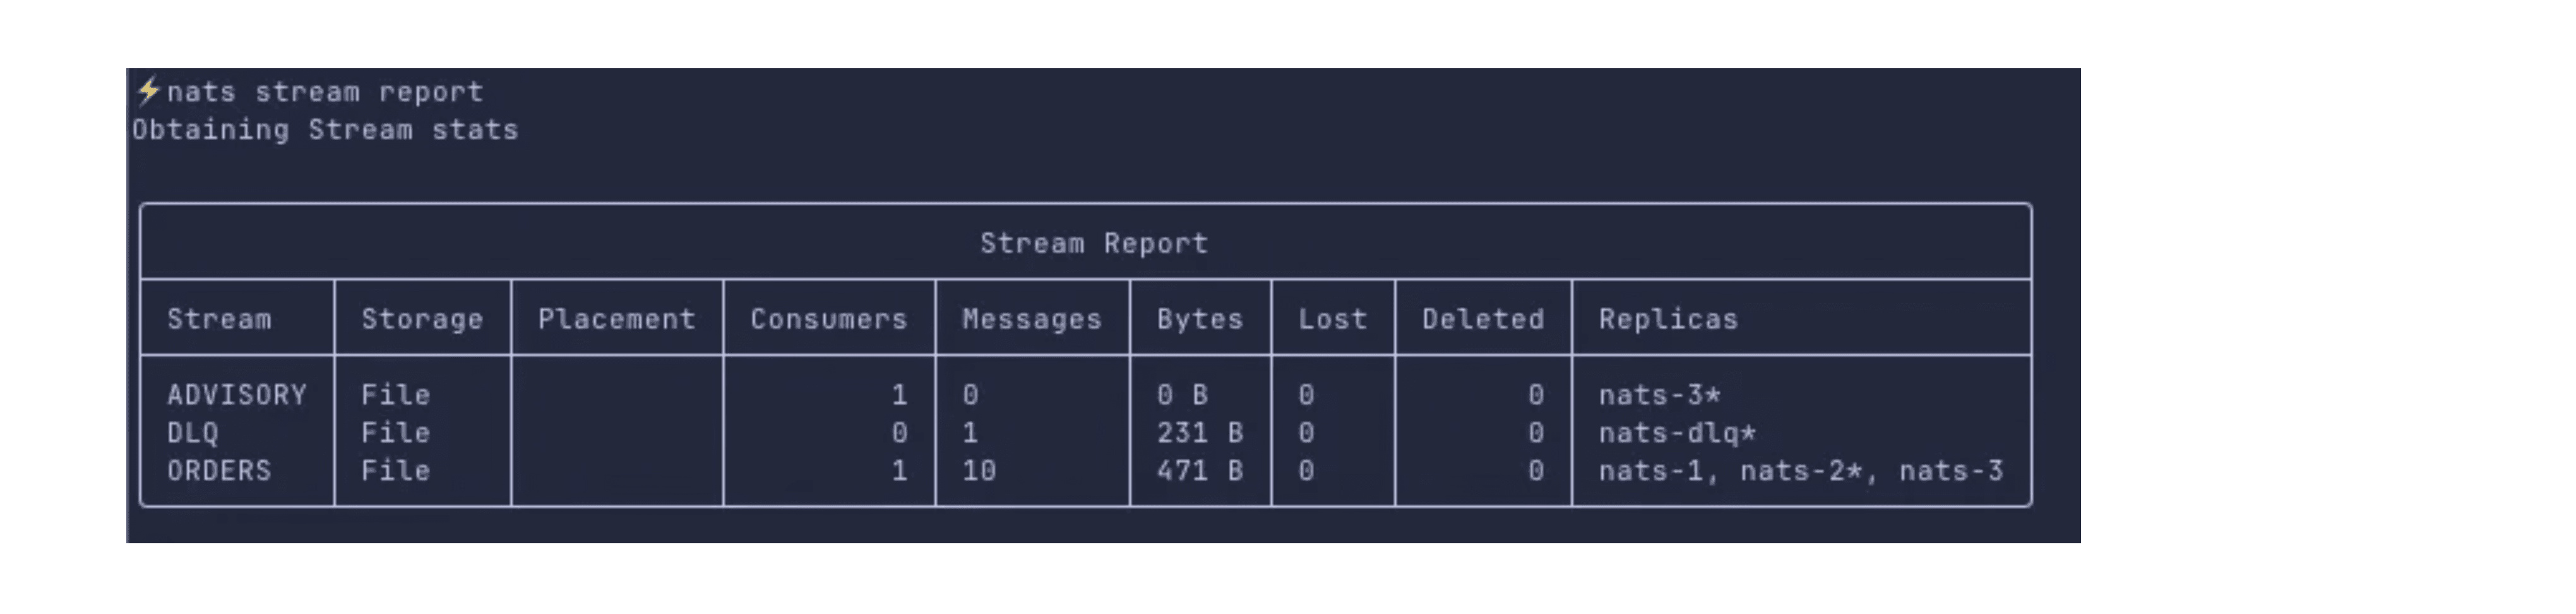
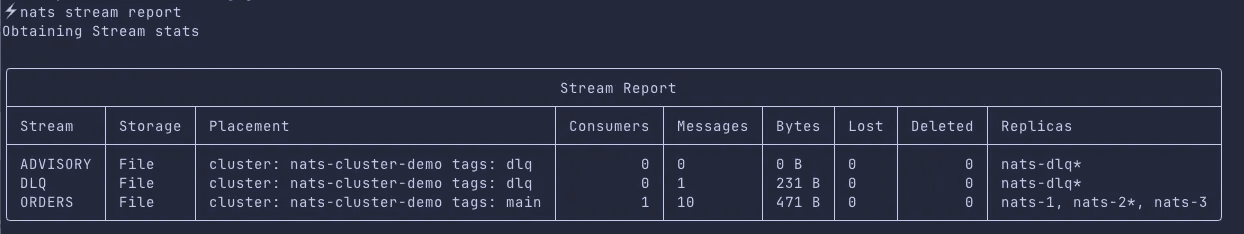
Here we can see there are three streams created:
ORDERS- our main stream. It has 3 replicas and the messages that we pushed via codeADVISORY- this stream contains messages which were not able to acknowledgedDLQ- this stream pulls the messages from$JS.EVENT.ADVISORY.CONSUMER.**.**.*subject, we have allocated a single node for this stream
In the above, we can ignore ADVISORY stream to send unacked messages to DLQ from our ORDERS stream. It’s one of the ways to do this.
Now let’s consider a scenario that our DLQ suddenly has lots of messages and we are not processing DLQ regularly, mostly once in a while processing happens.
Now due to sheer number and size of messages, whenever dlq node overlaps with one of the replica of other streams’ node, it will affect their performance.
So a general rule of thumb is to isolate the slow processing streams, or streams with large size from our regular streams
Here we can use placement
server_tagsthat we defined in our nats server config
Now, also a particular nats node (e.g. ec2 instance) can be used for more than one nats cluster
For better control, we must define which stream/node belongs to which cluster.
To achieve the above requirements, run the below commands:
nats stream edit ORDERS --replicas 3 --cluster nats-cluster-demo --tag main
nats stream edit DLQ --replicas 1 --cluster nats-cluster-demo --tag dlq
nats stream edit ADVISORY --replicas 1 --cluster nats-cluster-demo --tag
Load testing with NATS CLI
Now, let’s perform load tests to evaluate performance at scale (e.g., 10,000 messages/sec):
For publisher
nats bench js pub batch ORDERS.bench \
		 --clients 4 \
		 --msgs 500 \
		 --size 2MB \
		 --storage file \
		 --timeout 1s \
		 --batch 5 \
		 --create \
		 --purge
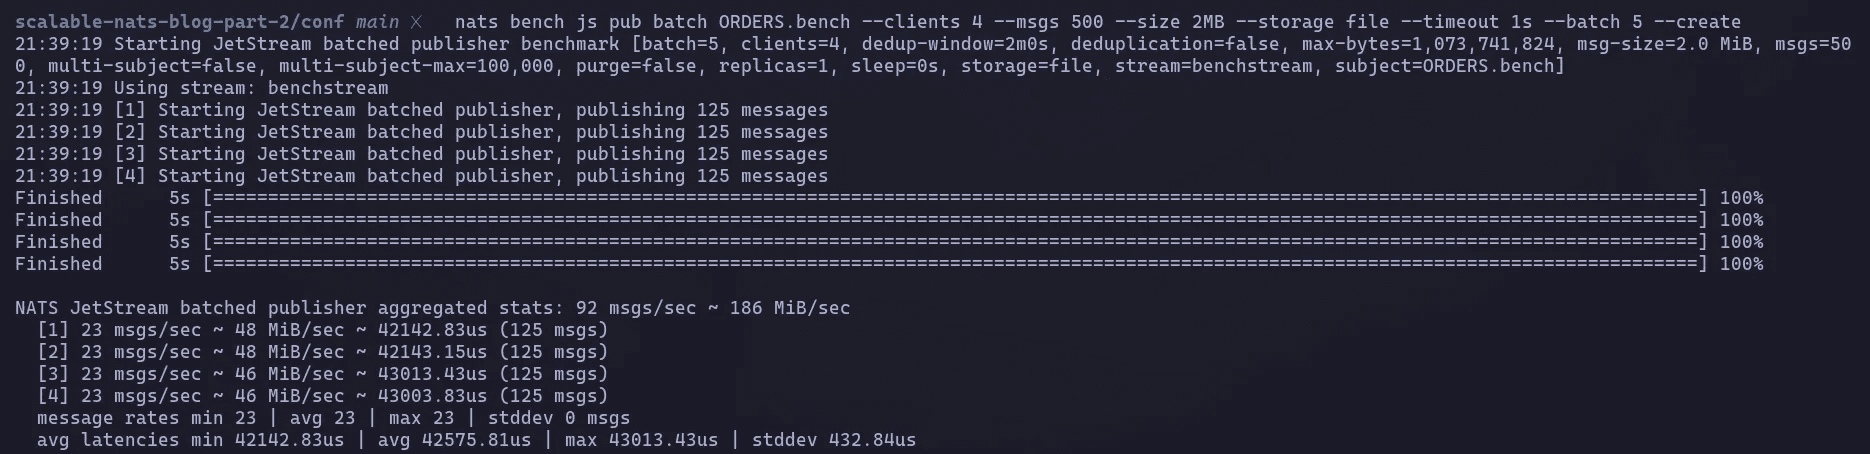
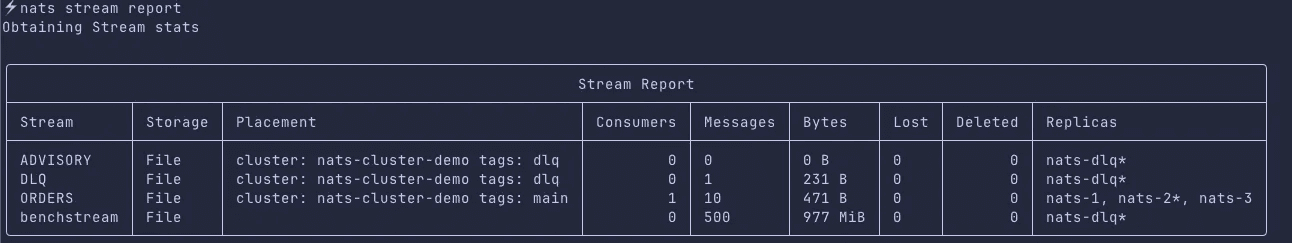
Running nats stream report
For subscriber (consumer)
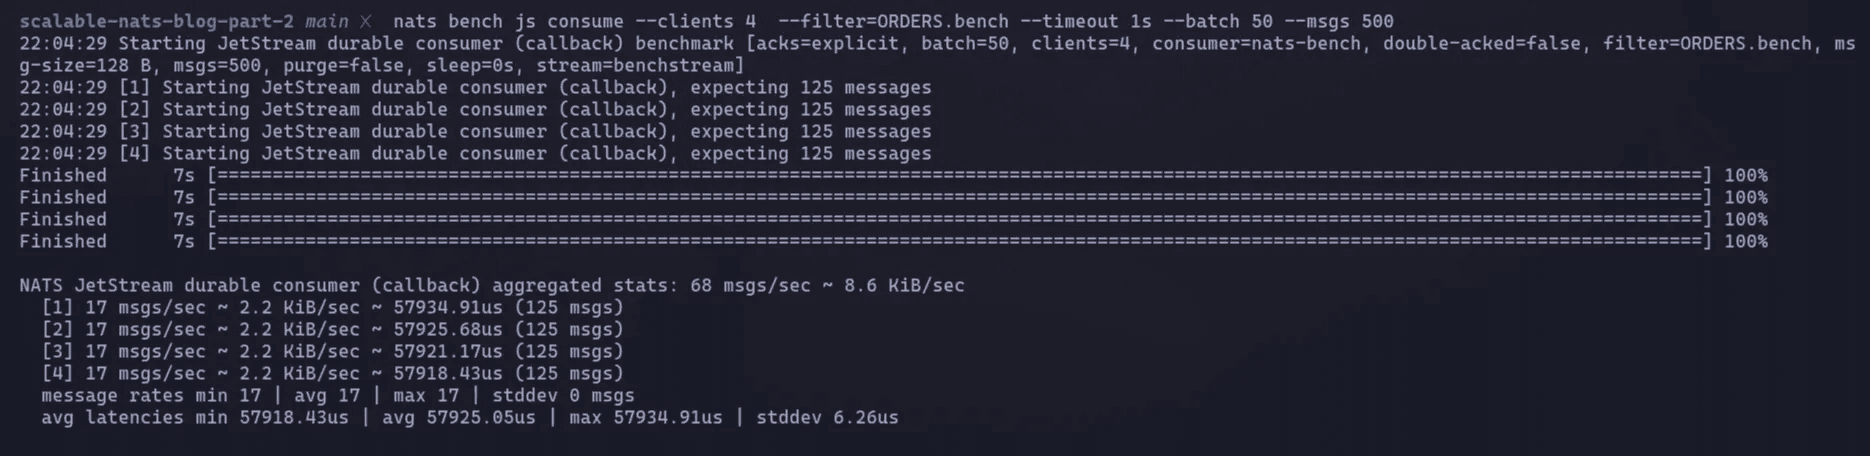
nats bench js consume --clients 4 --filter=ORDERS.bench --timeout 1s --batch 50 --msgs 50
Performance validation
Monitor key performance metrics via Grafana dashboards:
Message Throughput: Confirm message rates meet expectations.
JetStream Storage Performance: Monitor disk I/O and message persistence latency.
Resource Utilization: Track CPU and memory consumption.
Consumer Metrics: Identify slow or stuck consumers early.
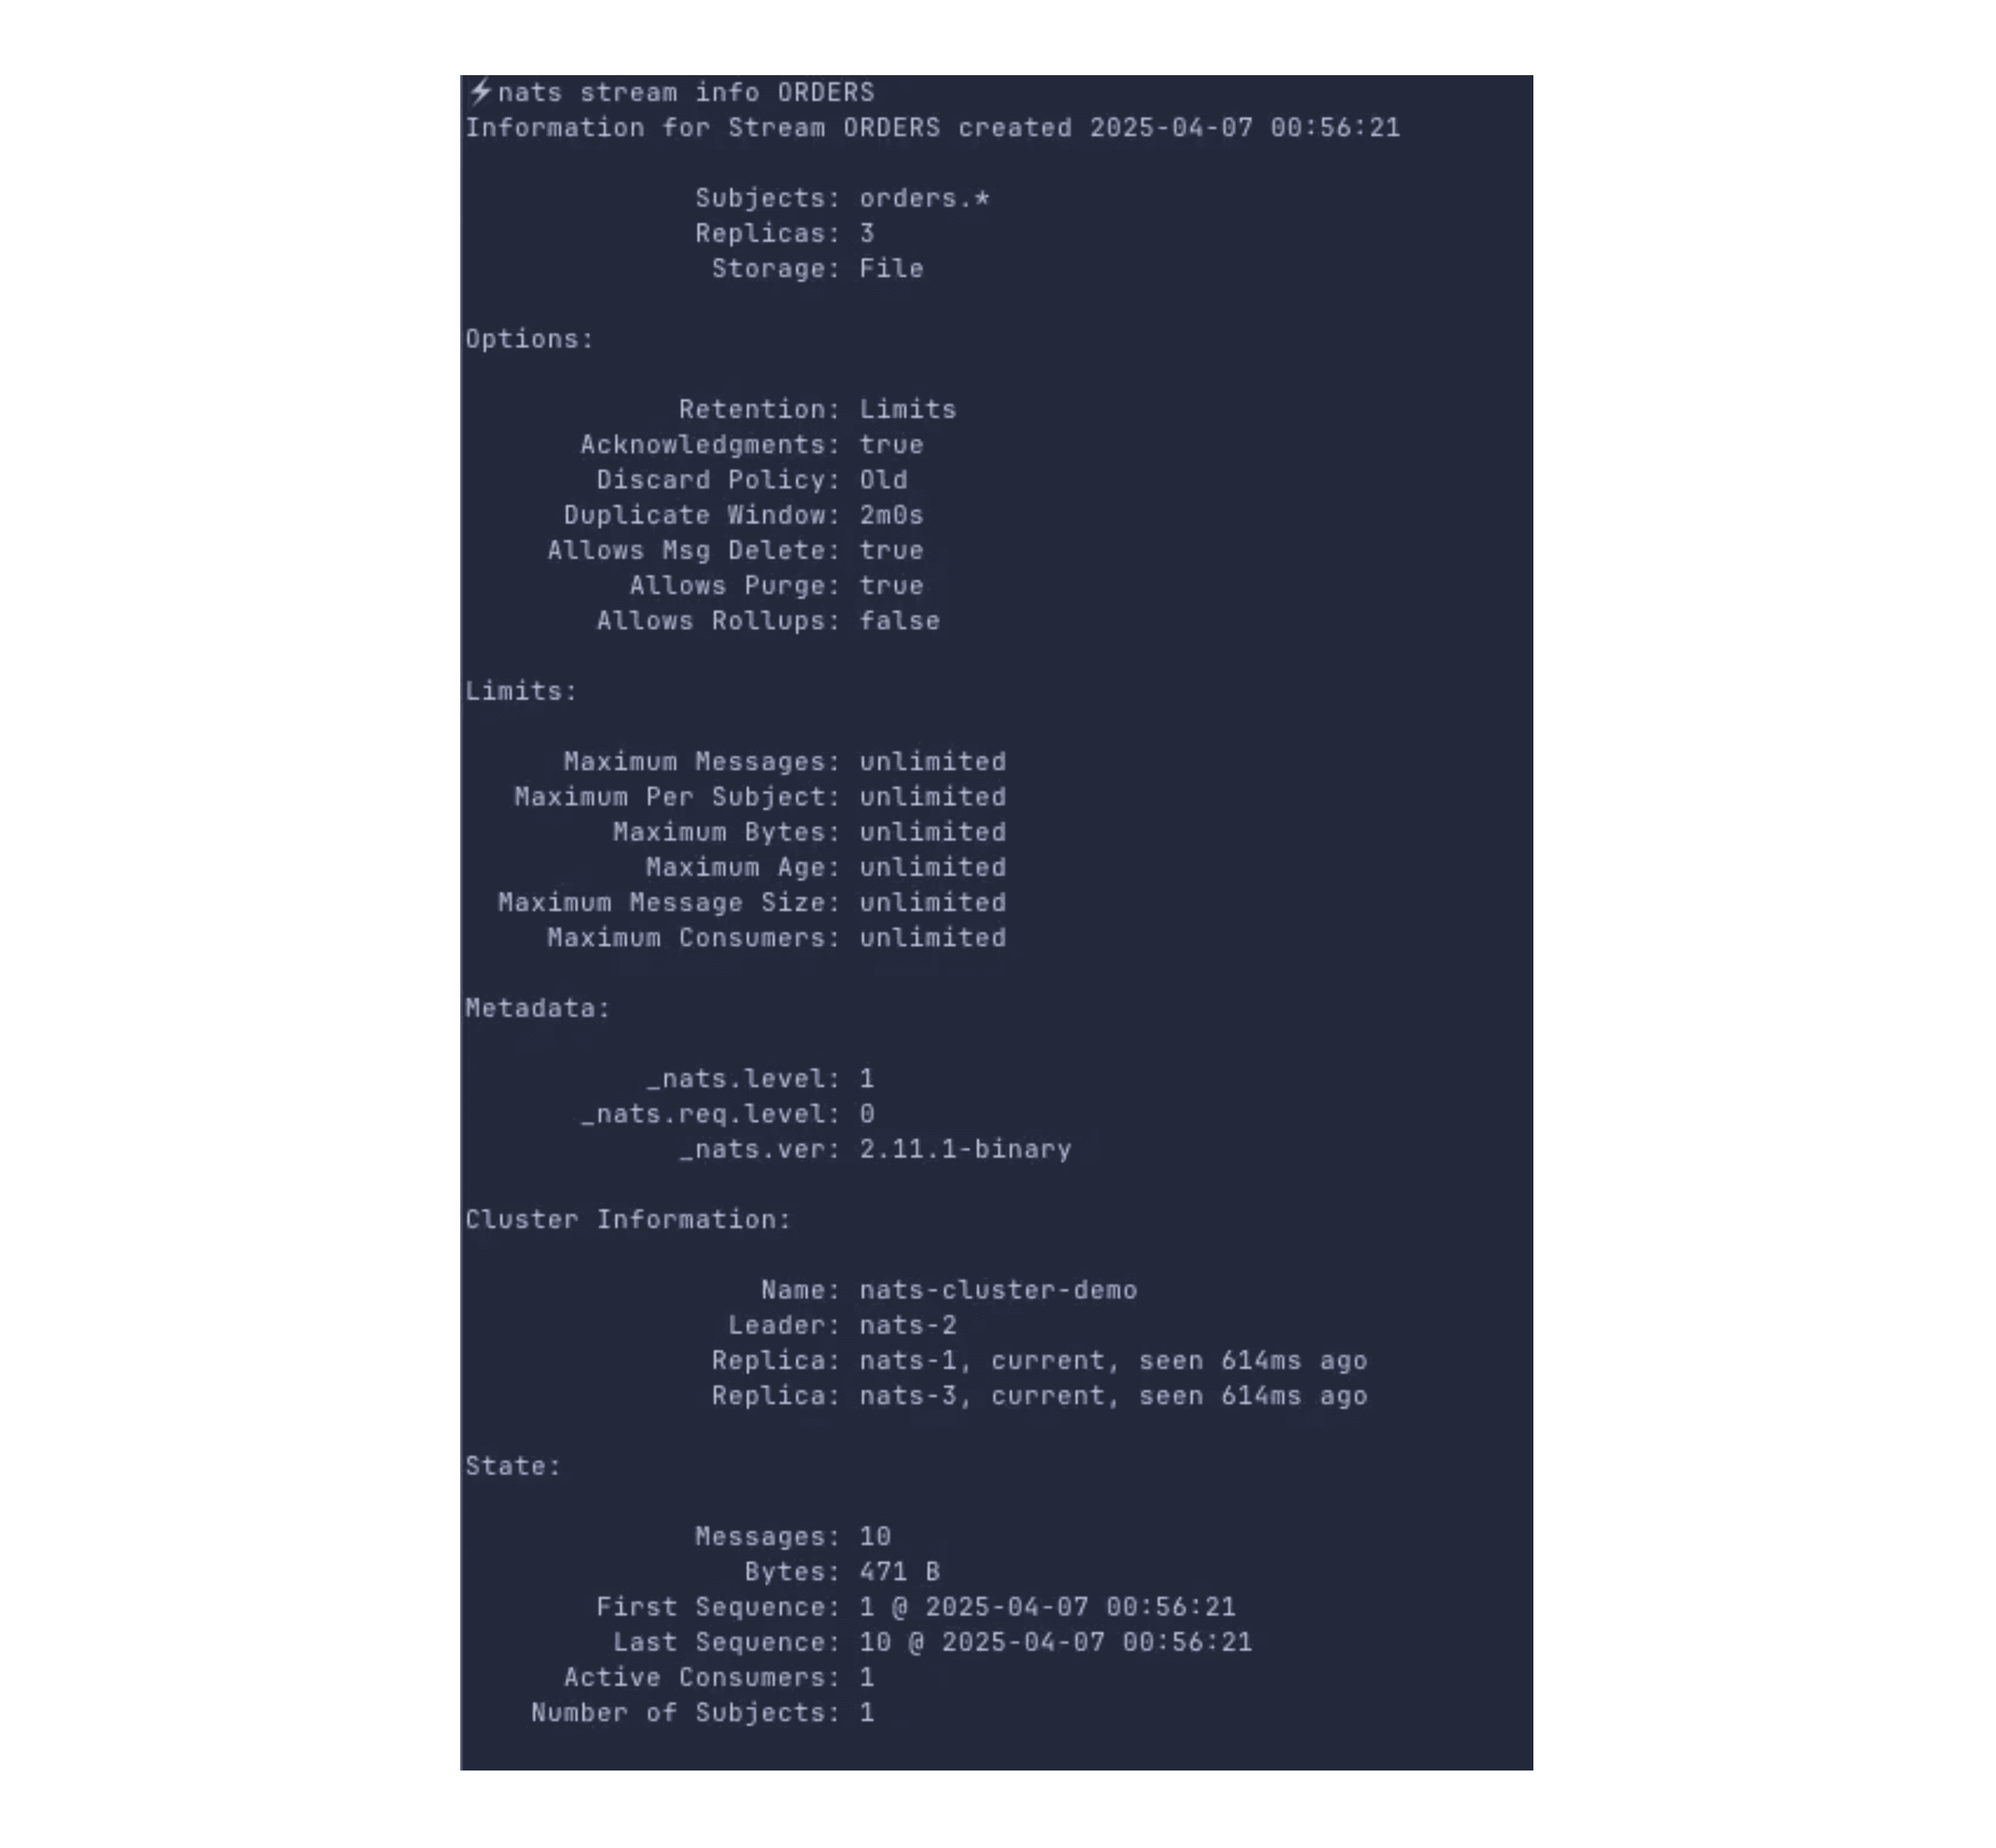
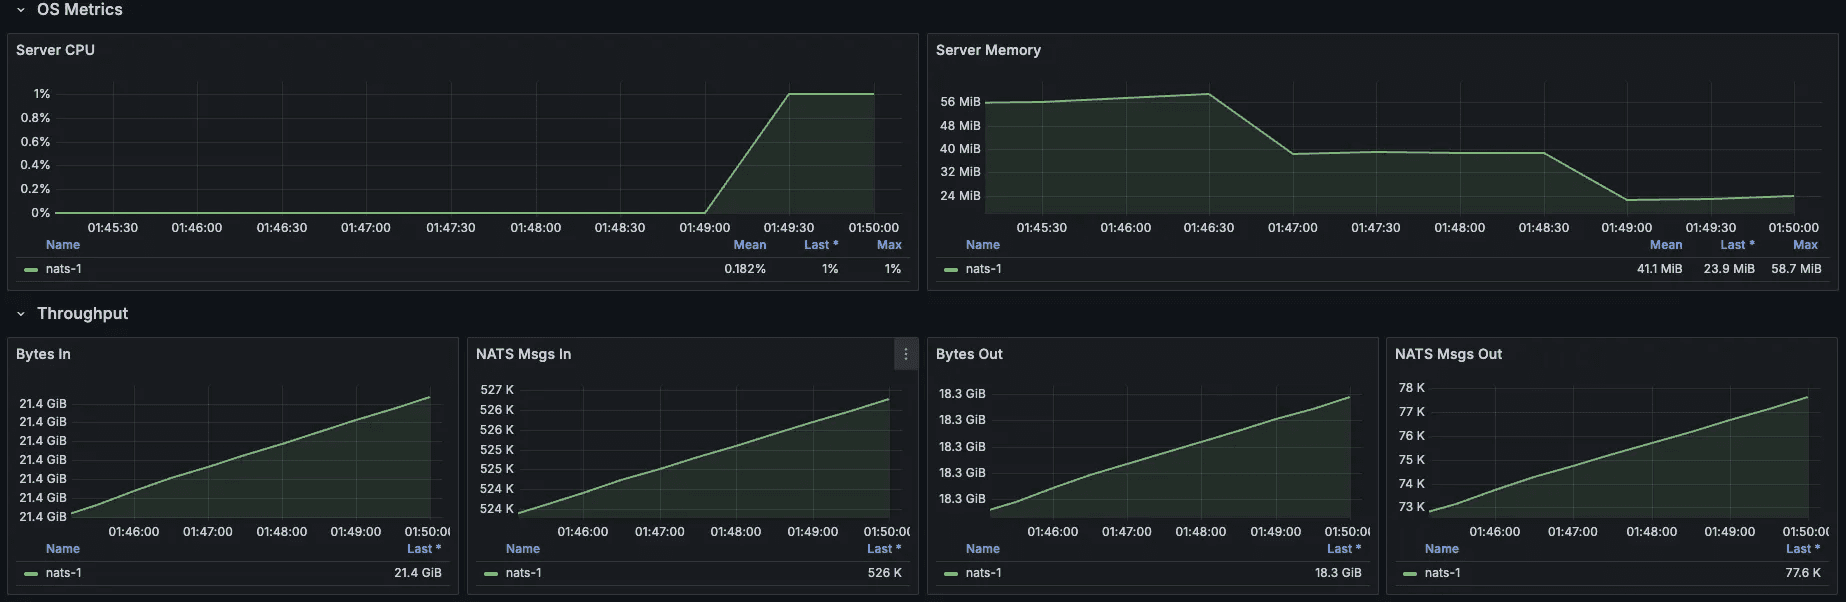
1. Stream metrics
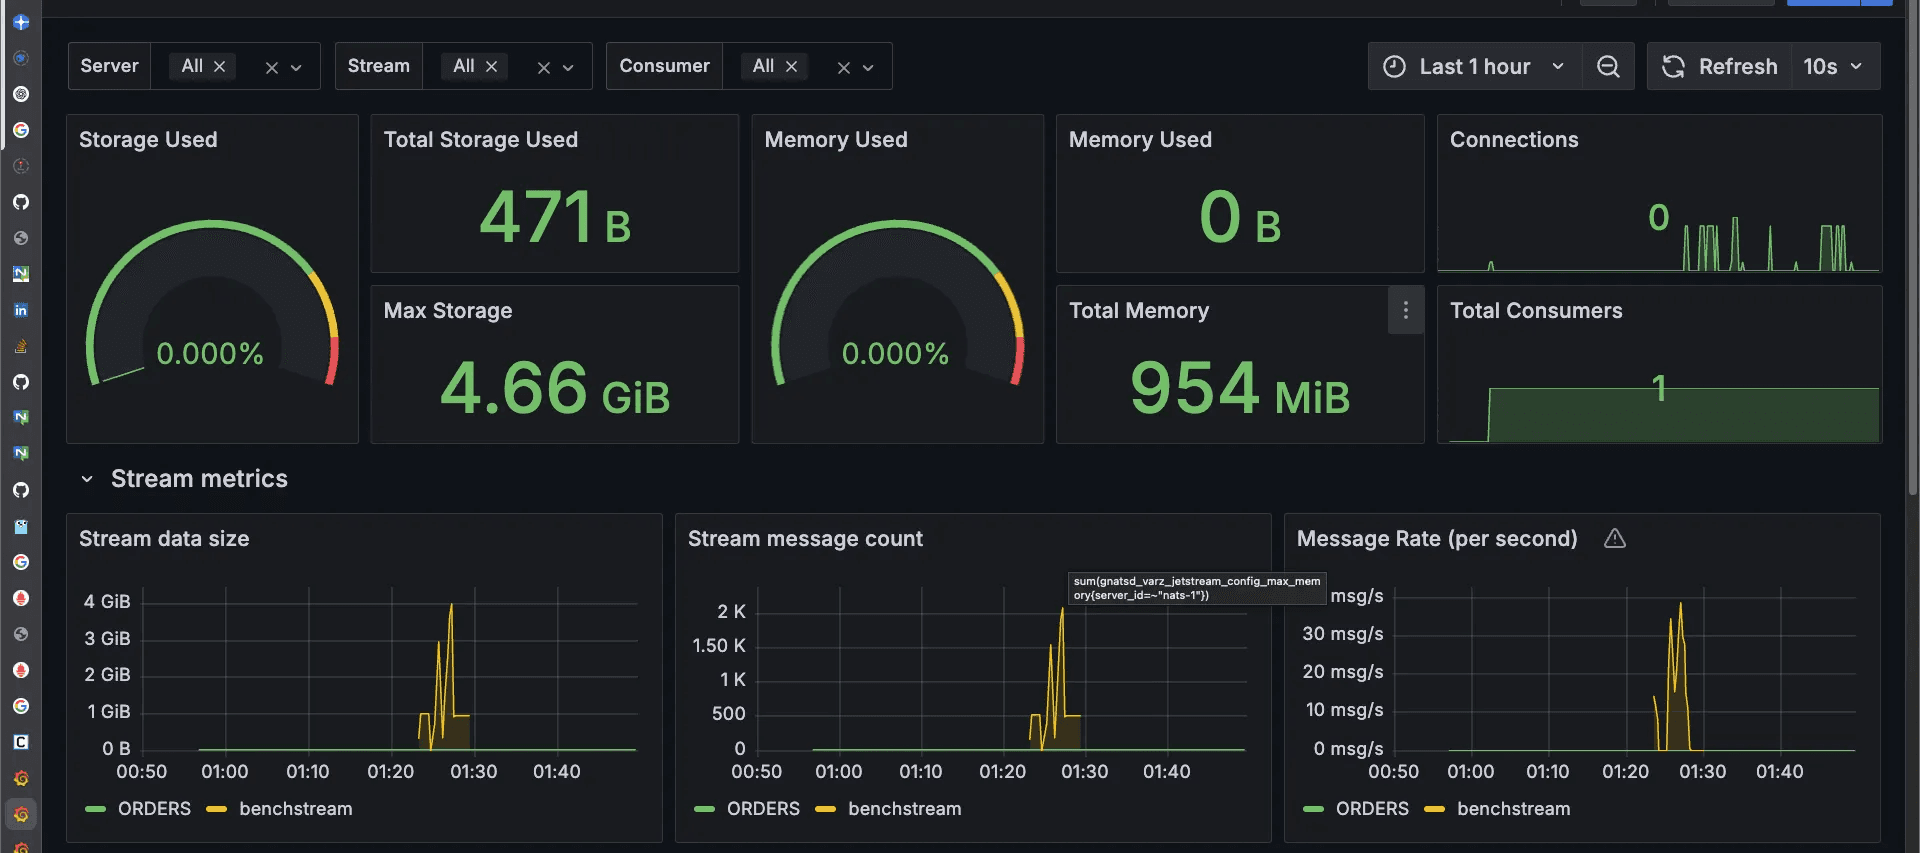
2. Server and throughput
Through this practical demonstration, you've successfully built, benchmarked, and optimized a highly available and scalable NATS messaging infrastructure tailored for production-grade deployments.
Conclusion
In this blog, we spun up a four node cluster, implemented observability, and also looked into disaster recovery options for NATS.
Across two posts, we went from learning NATS.io’s core architecture to a running, scalable NATS cluster.
What else you can do in NATS?
Key value Store - JetStream can server as a KV store
Authentication and authorization - Explore JWT accounts, fine grained publish/subscribe permissions and mutual TLS for both clients and inter cluster nodes
Object Store, Websockets, leaf nodes, super cluster and much more are available in a single small-sized NATS binary.
For further reading, visit NATS official documentation.
Links to the utilities and tools mentioned in the blog:
In Part 1 of the series "Deploying a Scalable NATS Cluster: Core Architecture and Considerations,” we learned about the foundational principles for designing a robust NATS.io deployment. Such as how to right-size a cluster, why we tag servers to keep busy nodes apart, the role of a Dead Letter Queue (DLQ) in resilient systems, and essential configurations like maximum payload size and the Go garbage collector's memory limit (GOMEMLIMIT).
In Part 2, we will do a hands-on demo based on the theoretical groundwork where we will construct a complete, production-grade, and fully observable 4-node NATS cluster using Docker:
create a four node cluster
add Prometheus and Grafana
push real traffic with the
nats benchto prove the sizing rules from Part 1.write a short Go program that interacts with NATS.
troubleshoot critical problems related to NATS
If you want to follow along, the companion git repo for the blog can be found here: https://github.com/d-cryptic/scalable-nats-blog-part-2
The anatomy of our resilient NATS cluster
1. Cluster configuration
server_name=nats-1 # e.g. nats-1, nats-2, nats-3, nats-dlq
listen=4222
jetstream {
    store_dir: /data/jetstream
    max_mem: 1G
    max_file: 5G
}
max_payload: 8M
http_port: 8222
server_tags: ["main"]

# set the below options to true only if needed
# debug: true
# trace: true

logtime: true
logfile_size_limit: 10M
log_file: "/tmp/nats-server.log"

accounts: {
    $SYS: {
        users: [
            {user: sys, password: sys_password}

        ]
    },
    JETSTREAM: {
        jetstream: true
        users: [
            {user: jetstream, password: jetstream_password}
        ]
    }

}

cluster {
  name: nats-cluster-demo # e.g. nats-cluster-region-1
  listen: 0.0.0.0:6222
  routes
Nodes:
3 Main Nodes: Form the core cluster with JetStream replication and quorum consensus.
1 DLQ Node: Handles Dead Letter Queue functionality, managing undelivered or problematic messages separately.
Tagging: Main nodes share the tag
main, while the DLQ node is taggeddlq.JetStream: Enabled with a replication factor of 3 for resilience.
2. Docker compose configuration
version: '3.8'

services:
  nats-1:
    image: nats:latest
    container_name: nats-1
    command: -c /etc/nats/nats-server.conf
    volumes:
      - ./nats-server-1.conf:/etc/nats/nats-server.conf
      - ./data/nats-1:/data/jetstream
      - ./nats-1.log:/tmp/nats-server.log
    ports:
      - 4222:4222
    networks:
      - nats_network
    environment:
     - GOMEMLIMIT=500MiB

  nats-2:
    image: nats:latest
    container_name: nats-2
    command: -c /etc/nats/nats-server.conf
    volumes:
      - ./nats-server-2.conf:/etc/nats/nats-server.conf
      - ./data/nats-2:/data/jetstream
      - ./nats-2.log:/tmp/nats-server.log
    ports:
      - 4223:4222
    networks:
      - nats_network
    environment:
      - GOMEMLIMIT=500MiB

  nats-3:
    image: nats:latest
    container_name: nats-3
    command: -c /etc/nats/nats-server.conf
    volumes:
      - ./nats-server-3.conf:/etc/nats/nats-server.conf
      - ./data/nats-3:/data/jetstream
      - ./nats-3.log:/tmp/nats-server.log
    ports:
      - 4224:4222
    networks:
      - nats_network
    environment:
      - GOMEMLIMIT=500MiB

  nats-dlq:
    image: nats:latest
    container_name: nats-dlq
    command: -c /etc/nats/nats-server.conf
    volumes:
      - ./nats-server-dlq.conf:/etc/nats/nats-server.conf
      - ./data/nats-dlq:/data/jetstream
      - ./nats-dlq.log:/tmp/nats-server.log
    ports:
      - 4225:4222
    networks:
      - nats_network
    environment:
      - GOMEMLIMIT=500MiB

  nats-exporter:
    image: natsio/prometheus-nats-exporter:latest
    container_name: nats-exporter
    command: "-use_internal_server_name -l /tmp/prometheus-nats-exporter.log -p 7778 -varz -subz -routez -leafz -jsz all -healthz -gatewayz -accstatz -connz_detailed <http://nats-1:8222>"
    ports:
      - "7778:7778"
    networks:
      - nats_network
    depends_on:
      - nats-1
      - nats-2
      - nats-3
      - nats-dlq

  prometheus:
    image: prom/prometheus:latest
    container_name: prometheus
    volumes:
      - ./prometheus.yml:/etc/prometheus/prometheus.yml
      - prometheus_data:/prometheus
    ports:
      - "9090:9090"
    networks:
      - nats_network
    depends_on:
      - nats-exporter

  grafana:
    image: grafana/grafana:latest
    container_name: grafana
    ports:
      - "3000:3000"
    volumes:
      - grafana_data:/var/lib/grafana
    networks:
      - nats_network
    depends_on:
      - prometheus

volumes:
  prometheus_data:
  grafana_data:

networks:
  nats_network:
    driver
We use Docker compose for seamless setup:
Each NATS server is individually configurable via separate config files.
All nodes communicate over an internal Docker network (
nats_network).Persistent volumes ensure message durability.
3. Integrated Monitoring
Prometheus collects metrics from all NATS nodes via the
nats-prometheus-exporter.Grafana provides insightful dashboards visualizing metrics, helping quickly identify bottlenecks and performance issues.
Go client code to interact with cluster
Use the following Go example to interact with the NATS cluster, publish messages, handle message acknowledgments, and process DLQ scenarios:
package main

import (
	"fmt"
	"log"
	"time"

	"github.com/nats-io/nats.go"
)

func main() {
	nats_conn_string := "nats://jetstream:jetstream_password@localhost:4222, nats://jetstream:jetstream_password@localhost:4223, nats://jetstream:jetstream_password@localhost:4224, nats://jetstream:jetstream_password@localhost:4225"

	// Connect to nats cluster
	nc, err := nats.Connect(nats_conn_string)
	if err != nil {
		log.Fatal(err)
	}
	defer nc.Drain()
	fmt.Println("connected")

	js, err := nc.JetStream()
	if err != nil {
		log.Fatal(err)
	}

	// Create a stream for main messages
	_, err = js.AddStream(&nats.StreamConfig{
		Name:     "ORDERS",
		Subjects: []string{"orders.*"},
		Replicas: 3,
	})

  if err != nil {
    log.Printf("Stream already exists or error: %v", err)
  }

  // Create DLQ stream for failed messages
  _, err = js.AddStream(&nats.StreamConfig{
    Name: "DLQ",
    Subjects: []string{"dlq.orders"},
    Replicas: 1,
  })
  if err != nil {
    log.Printf("DLQ Stream already exists or error: %v", err)
  }

  // Advisory stream (important!)
  js.AddStream(&nats.StreamConfig{
    Name:      "ADVISORY",
    Subjects:  []string{"$JS.EVENT.ADVISORY.>"},
    Storage:   nats.FileStorage,
    Retention: nats.InterestPolicy,
    Replicas:  1,
  })

  // Publish messages
  for i := 1; i <= 10; i++ {
    msg := fmt.Sprintf("order_%d", i)
    _, err := js.Publish("orders.new", []byte(msg))
    if err != nil {
      log.Printf("Publish error: %v", err)
    } else {
      fmt.Printf("Published: %s\\n", msg)
    }
  }

  // Create a consumer with max delivery attempts
  _, err = js.AddConsumer("ORDERS", &nats.ConsumerConfig{
    Durable: "order-processor",
    AckPolicy: nats.AckExplicitPolicy,
    DeliverPolicy: nats.DeliverAllPolicy,
    MaxDeliver: 3,
  })
  if err != nil {
    log.Printf("Consumer already exists or error: %v", err)
  }

  // Subscribe to consumer and simulate failure for DLQ
  _, err = js.PullSubscribe("orders.*", "order-processor")
  if err != nil {
    log.Fatal(err)
  }

  // Simulate consumer handling with forced failure
  sub, err := js.PullSubscribe("orders.*", "order-processor")
  if err != nil {
    log.Fatal(err)
  }

  for {
    msgs, err := sub.Fetch(5, nats.MaxWait(2*time.Second))
    if err != nil {
      log.Println("No more messages or fetch timeout")
      break
    }

    for _, msg := range msgs {
      fmt.Printf("Received: %s\\n", string(msg.Data))
      //Simulate processing failure
      if string(msg.Data) == "order_5" {
        fmt.Println("Simulated processing failure, not acking message:", string(msg.Data))
        continue
      }
      msg.Ack()
      fmt.Println("Acked:", string(msg.Data))
    }
  }

  //DLQ handling: Subscribe to Advisories and move message to DLQ Stream
  _, err = js.Subscribe("$JS.EVENT.ADVISORY.CONSUMER.*.*.*", func(m *nats.Msg) {
    metadata, err := m.Metadata()
    if err != nil {
      log.Println("Metadata error:", err)
      return
    }
    stream := metadata.Stream
    seq := metadata.Sequence.Stream

    // Fetch original message
    orgMsg, err := js.GetMsg(stream, seq)
    if err != nil {
      log.Println("Failed to get original message", err)
      return
    }

    // Publish to DLQ stream
    _, err = js.Publish("dlq.orders", orgMsg.Data)
    if err != nil {
      log.Println("Failed to publish to DLQ:",err)
    } else {
      fmt.Println("Message moved to DLQ:", string(orgMsg.Data))
    }
  })

  if err != nil {
    fmt.Println("here")
    log.Fatal(err)
  }

  // Keep application running
  select
Running the Demo:
Start the entire environment with one command:
docker-compose up -dPrometheus UI: Access metrics at http://localhost:9090.
Grafana UI: Visual dashboards available at http://localhost:3000.
Default credentials:
admin/admin.Import the official NATS JetStream dashboard (Dashboard ID:
12767) for comprehensive visualization.
nats context add nats-one2n-test --server nats://jetstream:jetstream_password@localhost:4222 --description "NATS One2n Demo" --select
This command will add a context to the NATS CLI which will help us to interact with our NATS Cluster
No streams are present. This is because we have to create streams with our required config either via code or via NATS CLI.
We will use Go Code to interact with our NATS cluster
go mod init nats-consumer-one2n-demo
go get github.com/nats-io/nats.go # install nats go client
Here we can see there are three streams created:
ORDERS- our main stream. It has 3 replicas and the messages that we pushed via codeADVISORY- this stream contains messages which were not able to acknowledgedDLQ- this stream pulls the messages from$JS.EVENT.ADVISORY.CONSUMER.**.**.*subject, we have allocated a single node for this stream
In the above, we can ignore ADVISORY stream to send unacked messages to DLQ from our ORDERS stream. It’s one of the ways to do this.
Now let’s consider a scenario that our DLQ suddenly has lots of messages and we are not processing DLQ regularly, mostly once in a while processing happens.
Now due to sheer number and size of messages, whenever dlq node overlaps with one of the replica of other streams’ node, it will affect their performance.
So a general rule of thumb is to isolate the slow processing streams, or streams with large size from our regular streams
Here we can use placement
server_tagsthat we defined in our nats server config
Now, also a particular nats node (e.g. ec2 instance) can be used for more than one nats cluster
For better control, we must define which stream/node belongs to which cluster.
To achieve the above requirements, run the below commands:
nats stream edit ORDERS --replicas 3 --cluster nats-cluster-demo --tag main
nats stream edit DLQ --replicas 1 --cluster nats-cluster-demo --tag dlq
nats stream edit ADVISORY --replicas 1 --cluster nats-cluster-demo --tag
Load testing with NATS CLI
Now, let’s perform load tests to evaluate performance at scale (e.g., 10,000 messages/sec):
For publisher
nats bench js pub batch ORDERS.bench \
		 --clients 4 \
		 --msgs 500 \
		 --size 2MB \
		 --storage file \
		 --timeout 1s \
		 --batch 5 \
		 --create \
		 --purge
Running nats stream report
For subscriber (consumer)
nats bench js consume --clients 4 --filter=ORDERS.bench --timeout 1s --batch 50 --msgs 50
Performance validation
Monitor key performance metrics via Grafana dashboards:
Message Throughput: Confirm message rates meet expectations.
JetStream Storage Performance: Monitor disk I/O and message persistence latency.
Resource Utilization: Track CPU and memory consumption.
Consumer Metrics: Identify slow or stuck consumers early.
1. Stream metrics
2. Server and throughput
Through this practical demonstration, you've successfully built, benchmarked, and optimized a highly available and scalable NATS messaging infrastructure tailored for production-grade deployments.
Conclusion
In this blog, we spun up a four node cluster, implemented observability, and also looked into disaster recovery options for NATS.
Across two posts, we went from learning NATS.io’s core architecture to a running, scalable NATS cluster.
What else you can do in NATS?
Key value Store - JetStream can server as a KV store
Authentication and authorization - Explore JWT accounts, fine grained publish/subscribe permissions and mutual TLS for both clients and inter cluster nodes
Object Store, Websockets, leaf nodes, super cluster and much more are available in a single small-sized NATS binary.
For further reading, visit NATS official documentation.
Links to the utilities and tools mentioned in the blog:
In this post
In this post
Section
Share
Share
Tags
In this post
section
Tags
Share
Keywords
NATS, NATS cluster, scalable NATS cluster, NATS demo, NATS Docker, JetStream, Dead Letter Queue, DLQ, SRE, Prometheus, Grafana, Go NATS client, production-grade messaging, cluster configuration, observability, load testing, resilient systems, cloud native, stream replication, container orchestration, message throughput, site reliability engineering, performance validation, One2N