

In our previous post on OpenTelemetry fundamentals, we explored how logs, metrics, and traces form the three pillars of observability and how OpenTelemetry brings them together under a single, vendor-neutral standard.
This post builds on that foundation. We’ll dive deeper into the OpenTelemetry Collector, the heart of any OTel-based observability pipeline and show you how to make it production-ready. You’ll learn how to handle challenges like rate limits, noisy telemetry, missing metadata, and high data volumes using key Collector processors that improve scalability, stability, and cost-efficiency.
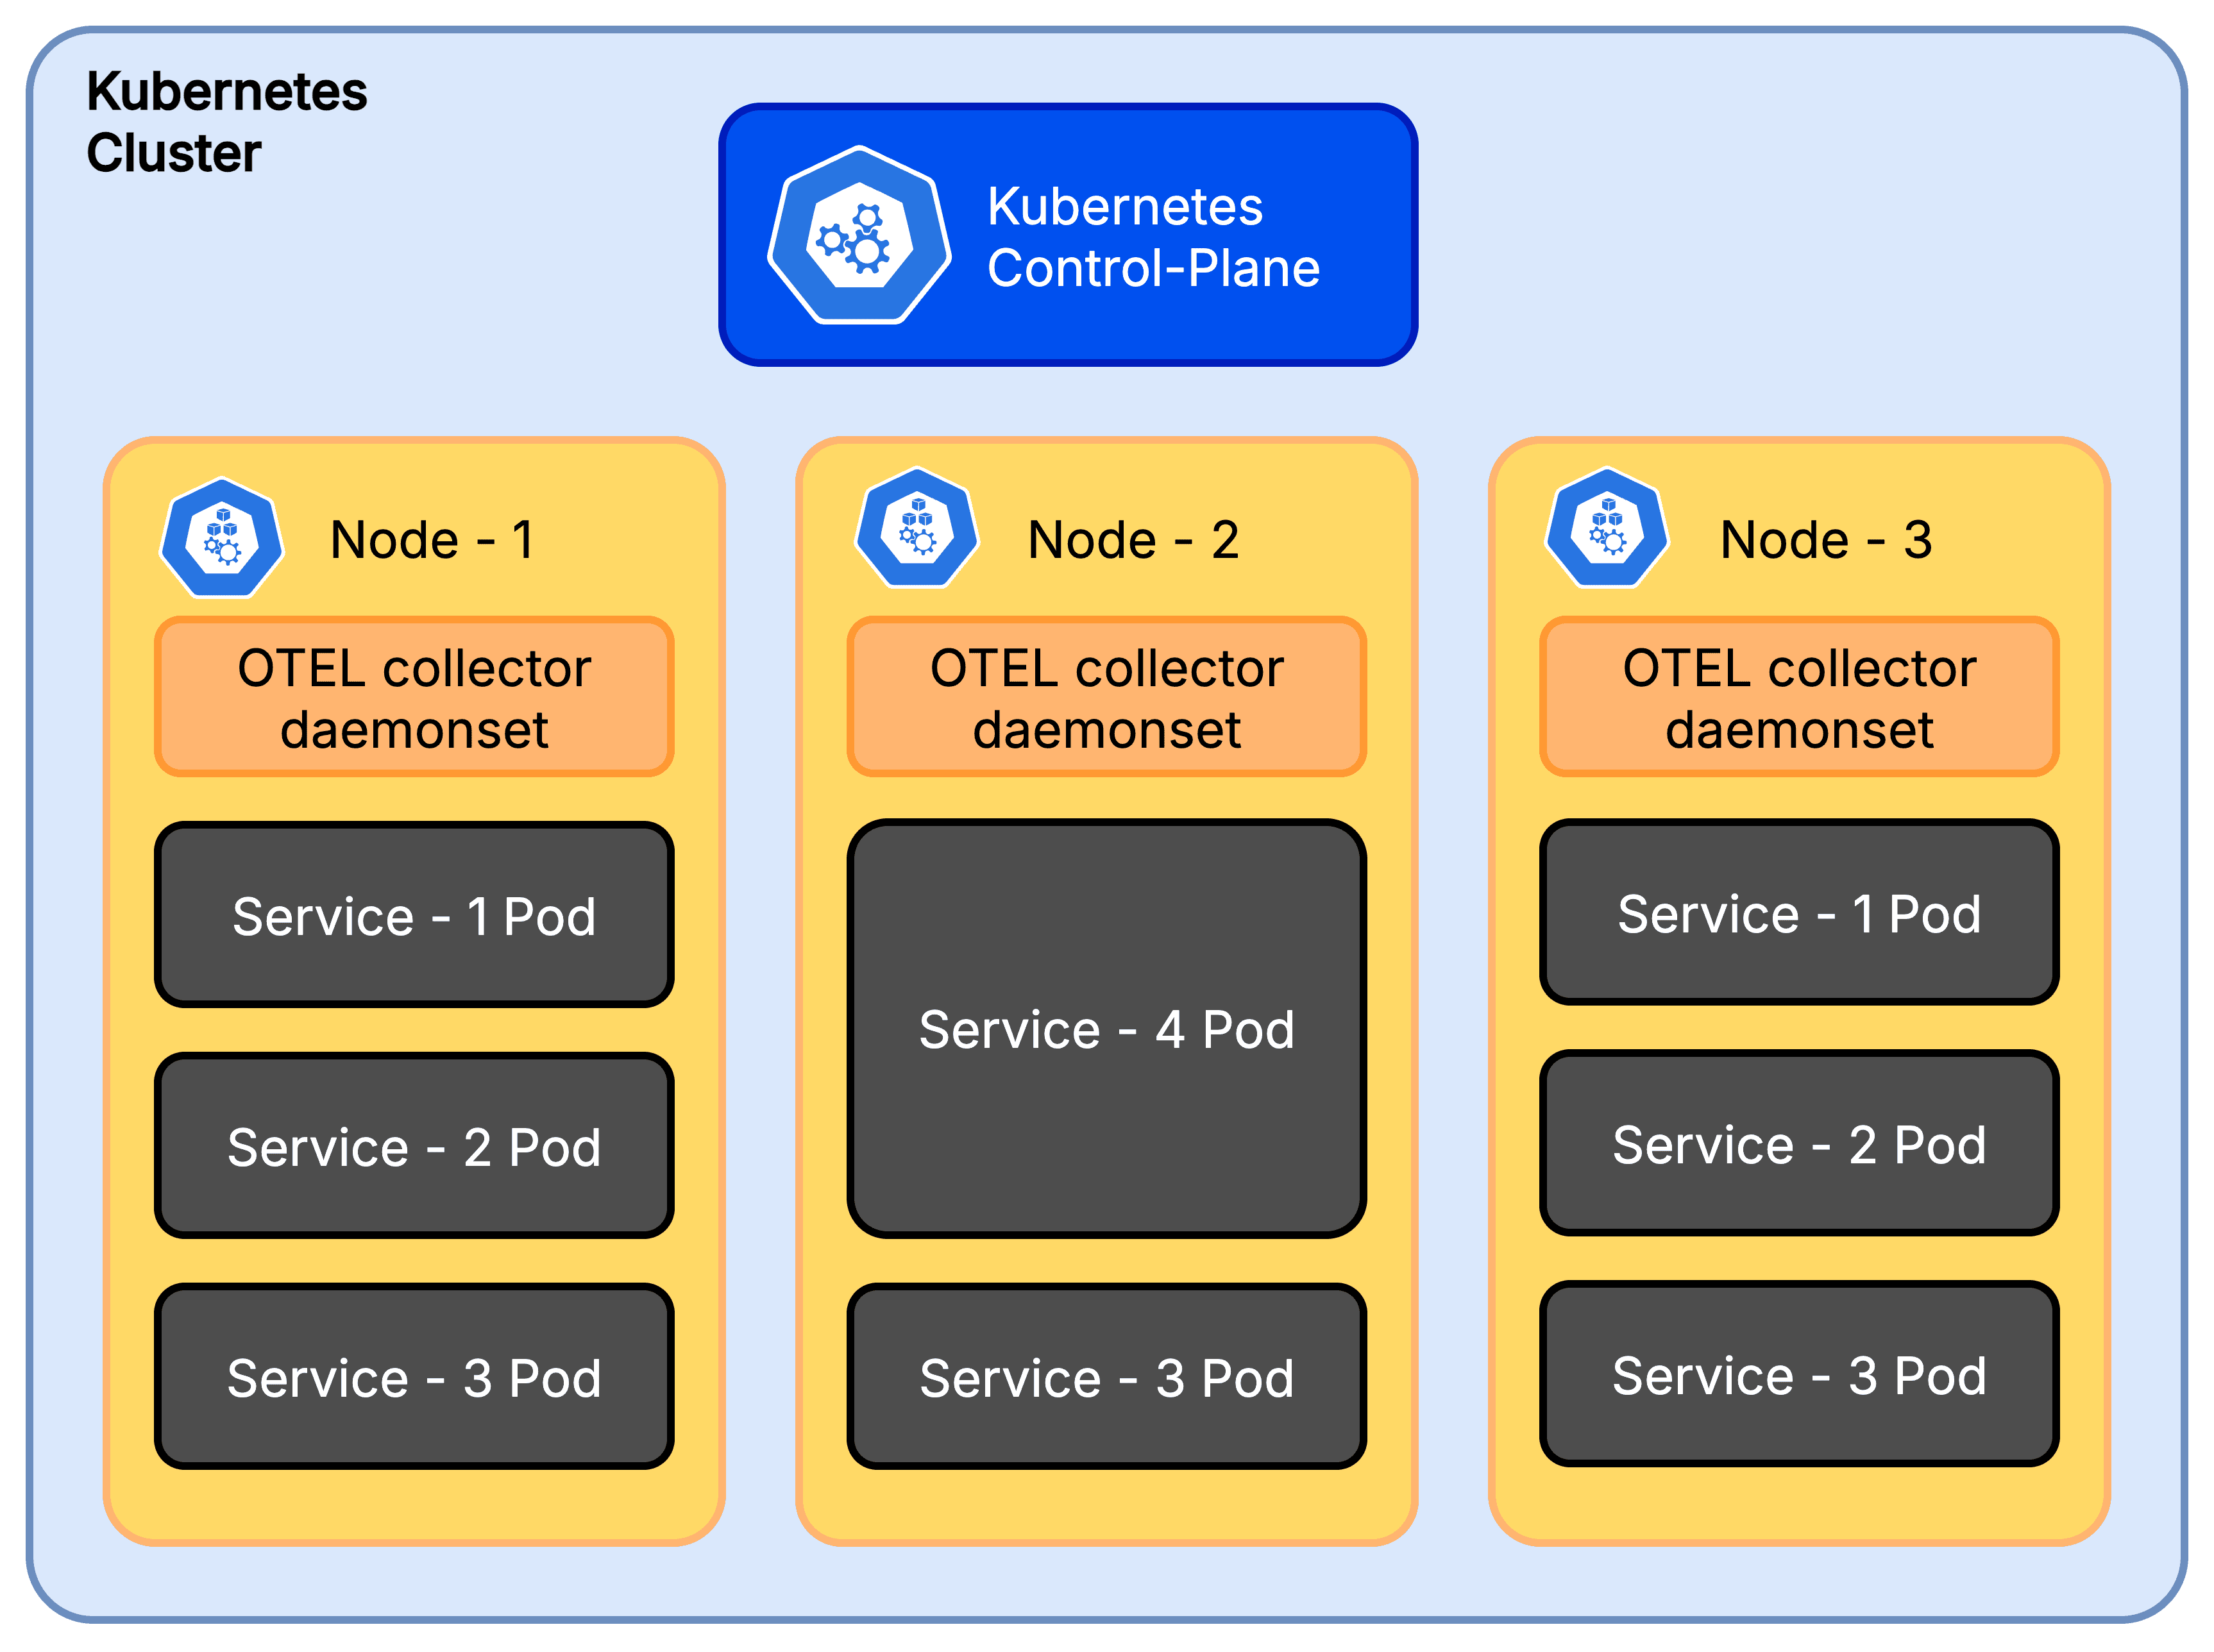
We selected OpenTelemetry because of its vendor neutrality and strong community backing. The customer had a typical cloud-native stack running on Kubernetes, and our goal was to build a scalable, cost-effective, and maintainable telemetry pipeline.
Turning on OpenTelemetry was the easy part. Within minutes, we saw traces, metrics, and logs flowing into the observability backend. But as production traffic grew, issues popped up. We saw problems like:
API rate limits: the backend started rejecting requests
Collector crashes: pods were running out of memory
Too much noise: health checks cluttered everything
Rising costs: we were sending far more data than necessary
The hard part was managing, filtering, and routing all that data at scale. In Kubernetes, each service can emit hundreds of spans every second. Sending everything to the backend without control quickly became unsustainable. We had to design our Collector pipeline to be smarter.
In this post, we walk through each problem we faced, the Collector processors that saved us, and the final architecture decisions that made our observability stack scalable and cost-effective.
Problem 1: Rate limiting hell
After deploying OTel collectors to production, we began our routine monitoring of the collector logs during high-traffic windows. We noticed the logs were cluttered with Exporting failed messages, specifically 429 Too Many Requests errors. The backend was rate limiting us.
Why did it happen?
OpenTelemetry has the ability to send one span per request, or it can batch spans as part of the configuration. Without batching, the collector was sending each span as an individual request. This overwhelmed the backend almost instantly.
Solution: We added a batch processor at the end of our pipeline to group spans into chunks.
Sample Batch Processor Config :
processors:
  batch:
    timeout: 30s
    send_batch_size: 1000
With this, the collector buffers spans and sends them in bulk (every 30s or 1000 spans), instead of one by one. This dramatically cut the number of API calls we made and kept us under quota.
When we placed the batch processor early in the pipeline, it batched all incoming data, logs/spans/metrics that were later dropped. This wasted CPU and memory without preventing rate limits.
Moving it to the end of the pipeline (after filtering and sampling) ensured only the final, filtered data was batched and exported.
Problem 2: Memory spikes and collector crashes
A few days into production, we noticed our collector pods were restarting more frequently than expected. We checked the Kubernetes events for the affected pods and saw that they were getting OOMKilled.
Digging deeper, we found that restarts spiked between 1 PM and 3 PM which was the same window when our application traffic peaked. The increasing telemetry data caused memory usage to exceed the pod limit, triggering Kubernetes to evict the collector. Each crash led to missing telemetry data.
Why did it happen ?
The collector had no guardrails in place. It tried to buffer everything in memory, even during spikes. This led to sudden out-of-memory kills.
Solution: We added the memory_limiter processor as the very first step in the pipeline.
Sample Memory Limiter Config :
processors:
  memory_limiter:
    check_interval: 5s
    limit_mib: 500
    spike_limit_mib: 100
The processor checks memory usage every 5 seconds. When usage crosses the soft limit (limit_mib - spike_limit_mib), it starts rejecting new data by returning errors to the previous component in the pipeline.
If usage continues to climb and breaches the hard limit ( limit_mib ), it goes a step further, forcing garbage collection to be performed. This gave the collector room to breathe. Instead of crashing, it sheds excess load and recovered quickly.
It's crucial to understand the trade-off: when the memory limiter is triggered, it starts rejecting new data to prevent a crash. This means you will lose telemetry data during traffic spikes. We worked with the application teams to analyze the data volume and tune both the application's telemetry generation and the collector's limits to find a balance between stability and data fidelity.
The
memory_limiterprocessor should be placed first in the pipeline. This ensures that backpressure can reach upstream receivers, minimizing the likelihood of dropped data when memory limits are triggered.
Since the OpenTelemetry Collector is written in Go, we set the
GOMEMLIMITenvironment variable to align Go’s garbage collector with ourlimit_mib. This ensures Go’s internal memory management respects the Collector’s configured limits, preventing unexpected memory overflows.
Problem 3: Noisy telemetry from auto-instrumentation
We loved auto-instrumentation, but it had a side effect: too much noisy data. Our apps were tracing every /health and /status check. Some auto-instrumentation libraries, like opentelemetry.HTTPInstrumentation, were exporting detailed metrics for every single HTTP request, including health checks. This low-value telemetry data drowned out the real signals and increased our storage costs.
Why did it happen ?
Auto-instrumentation is designed to be helpful by default. But without filtering, it sends everything including the data you don't need.
Solution: We used the filter processor to drop everything we didn’t need. Here’s a simplified filter we applied.
Sample Filter Processor Config :
processors:
  filter:
    error_mode: ignore
    traces:
      span:
        - 'IsMatch(attributes["http.route"], ".*/(health|status).*")'
    metrics:
      datapoint:
        - 'IsMatch(attributes["http.route"], ".*/(health|status).*")'
This config drops any trace spans and metric datapoints whose http.route matches health or status endpoints. After applying the filter, we unclogged our backend. This small change made our traces and metrics far more useful.
Problem 4: Missing Kubernetes metadata in telemetry
Our services ran in Kubernetes, but the telemetry data lacked critical operational context. Spans and logs had no namespace, pod name, or deployment info. Without this context, debugging was inefficient. We could see a slow trace, but we couldn't immediately correlate it to a specific pod that might be resource-starved or a deployment that had just been rolled out. Adding labels manually in every app was not an option.
Solution: we used the k8sattributes processor to automatically enrich telemetry with Kubernetes metadata.
processors:
  k8sattributes:
    passthrough: false
    auth_type: serviceAccount
    pod_association:
      - sources:
          - from: resource_attribute
            name: k8s.pod.ip
    extract:
      metadata
This attaches metadata like namespace, pod name, and deployment to each span and log. Now every span and log includes fields that make filtering and building dashboards much more powerful.
A word of caution: adding these attributes, especially high-cardinality ones (like
k8s.pod.id,k8s.node.id), increases your payload size and can significantly drive up costs, particularly for metrics. Additionally, in environments with autoscaling, a pod ID you see in telemetry might have already been terminated or scaled in by the time you debug. Be selective about which attributes you attach to which signals to balance observability and cost.
Problem 5: High-volume traces but no signal
With tracing turned on everywhere, our backend was flooded with thousands of traces per minute. During incidents, the important traces those with errors, timeouts, or high latency were buried under a mountain of successful 200-OK requests. It felt like searching for a needle in a haystack.
Why it happened: We were exporting everything. The traces we actually needed for debugging were a small fraction of the total volume.
Solution: We added the tail_sampling processor to keep only the traces that matter. Tail sampling waits until a trace is complete before deciding whether to keep it, allowing you to filter based on error status, latency, or other attributes.
Example Tail Sampling Config :
processors:
  tail_sampling:
    decision_wait: 30s
    policies:
      - name: errors-policy
        type: status_code
        status_code:
          status_codes:
	          - ERROR
	          - UNSET
      - name: keep-slow-traces
        type: latency
        latency:
          threshold_ms: 2000
      - name: randomized-policy
        type: probabilistic
        probabilistic:
          sampling_percentage: 10
This setup ensured we:
Always export traces with errors.
Export slow requests (latency ≥ 2000 ms).
Randomly sample 10% of all other traces for a baseline.
It's important to recognize that tail sampling is resource-intensive. The collector must hold all spans for a trace in memory while it waits for the trace to complete, which increases its compute and memory requirements. The policies are also highly flexible; for instance, you can add rules to filter based on span size, allowing you to drop exceptionally large spans unless they contain an error, further optimizing costs.
By carefully configuring these processors, we built a robust and efficient pipeline that delivered actionable insights without overwhelming our backend or our budget.
Conclusion
Scaling observability is less about simply enabling instrumentation and more about smart processing of telemetry data. OpenTelemetry makes it easy to collect traces, metrics, and logs, but making a pipeline production-ready requires careful design and the right processors.
In our case, we solved major challenges like rate limits, memory spikes, noisy telemetry, missing metadata, and high-volume traces by strategically using key processors and redesigning our Collector pipeline. This approach allowed us to control costs, maintain stability, and retain the telemetry that truly mattered.
The next time you enable telemetry, keep in mind that effective observability depends as much on how you process the data as it does on collecting it. A well-tuned collector pipeline can be the difference between actionable insights and overwhelming noise or worse, silent failure.
In the next post, we’ll dive into a particularly tricky challenge we faced while enabling tail sampling in a distributed system. You’ll see how we handled delayed traces, coordinated sampling decisions across multiple services, and ensured we captured the right data without overwhelming our backend.
In our previous post on OpenTelemetry fundamentals, we explored how logs, metrics, and traces form the three pillars of observability and how OpenTelemetry brings them together under a single, vendor-neutral standard.
This post builds on that foundation. We’ll dive deeper into the OpenTelemetry Collector, the heart of any OTel-based observability pipeline and show you how to make it production-ready. You’ll learn how to handle challenges like rate limits, noisy telemetry, missing metadata, and high data volumes using key Collector processors that improve scalability, stability, and cost-efficiency.
We selected OpenTelemetry because of its vendor neutrality and strong community backing. The customer had a typical cloud-native stack running on Kubernetes, and our goal was to build a scalable, cost-effective, and maintainable telemetry pipeline.
Turning on OpenTelemetry was the easy part. Within minutes, we saw traces, metrics, and logs flowing into the observability backend. But as production traffic grew, issues popped up. We saw problems like:
API rate limits: the backend started rejecting requests
Collector crashes: pods were running out of memory
Too much noise: health checks cluttered everything
Rising costs: we were sending far more data than necessary
The hard part was managing, filtering, and routing all that data at scale. In Kubernetes, each service can emit hundreds of spans every second. Sending everything to the backend without control quickly became unsustainable. We had to design our Collector pipeline to be smarter.
In this post, we walk through each problem we faced, the Collector processors that saved us, and the final architecture decisions that made our observability stack scalable and cost-effective.
Problem 1: Rate limiting hell
After deploying OTel collectors to production, we began our routine monitoring of the collector logs during high-traffic windows. We noticed the logs were cluttered with Exporting failed messages, specifically 429 Too Many Requests errors. The backend was rate limiting us.
Why did it happen?
OpenTelemetry has the ability to send one span per request, or it can batch spans as part of the configuration. Without batching, the collector was sending each span as an individual request. This overwhelmed the backend almost instantly.
Solution: We added a batch processor at the end of our pipeline to group spans into chunks.
Sample Batch Processor Config :
processors:
  batch:
    timeout: 30s
    send_batch_size: 1000
With this, the collector buffers spans and sends them in bulk (every 30s or 1000 spans), instead of one by one. This dramatically cut the number of API calls we made and kept us under quota.
When we placed the batch processor early in the pipeline, it batched all incoming data, logs/spans/metrics that were later dropped. This wasted CPU and memory without preventing rate limits.
Moving it to the end of the pipeline (after filtering and sampling) ensured only the final, filtered data was batched and exported.
Problem 2: Memory spikes and collector crashes
A few days into production, we noticed our collector pods were restarting more frequently than expected. We checked the Kubernetes events for the affected pods and saw that they were getting OOMKilled.
Digging deeper, we found that restarts spiked between 1 PM and 3 PM which was the same window when our application traffic peaked. The increasing telemetry data caused memory usage to exceed the pod limit, triggering Kubernetes to evict the collector. Each crash led to missing telemetry data.
Why did it happen ?
The collector had no guardrails in place. It tried to buffer everything in memory, even during spikes. This led to sudden out-of-memory kills.
Solution: We added the memory_limiter processor as the very first step in the pipeline.
Sample Memory Limiter Config :
processors:
  memory_limiter:
    check_interval: 5s
    limit_mib: 500
    spike_limit_mib: 100
The processor checks memory usage every 5 seconds. When usage crosses the soft limit (limit_mib - spike_limit_mib), it starts rejecting new data by returning errors to the previous component in the pipeline.
If usage continues to climb and breaches the hard limit ( limit_mib ), it goes a step further, forcing garbage collection to be performed. This gave the collector room to breathe. Instead of crashing, it sheds excess load and recovered quickly.
It's crucial to understand the trade-off: when the memory limiter is triggered, it starts rejecting new data to prevent a crash. This means you will lose telemetry data during traffic spikes. We worked with the application teams to analyze the data volume and tune both the application's telemetry generation and the collector's limits to find a balance between stability and data fidelity.
The
memory_limiterprocessor should be placed first in the pipeline. This ensures that backpressure can reach upstream receivers, minimizing the likelihood of dropped data when memory limits are triggered.
Since the OpenTelemetry Collector is written in Go, we set the
GOMEMLIMITenvironment variable to align Go’s garbage collector with ourlimit_mib. This ensures Go’s internal memory management respects the Collector’s configured limits, preventing unexpected memory overflows.
Problem 3: Noisy telemetry from auto-instrumentation
We loved auto-instrumentation, but it had a side effect: too much noisy data. Our apps were tracing every /health and /status check. Some auto-instrumentation libraries, like opentelemetry.HTTPInstrumentation, were exporting detailed metrics for every single HTTP request, including health checks. This low-value telemetry data drowned out the real signals and increased our storage costs.
Why did it happen ?
Auto-instrumentation is designed to be helpful by default. But without filtering, it sends everything including the data you don't need.
Solution: We used the filter processor to drop everything we didn’t need. Here’s a simplified filter we applied.
Sample Filter Processor Config :
processors:
  filter:
    error_mode: ignore
    traces:
      span:
        - 'IsMatch(attributes["http.route"], ".*/(health|status).*")'
    metrics:
      datapoint:
        - 'IsMatch(attributes["http.route"], ".*/(health|status).*")'
This config drops any trace spans and metric datapoints whose http.route matches health or status endpoints. After applying the filter, we unclogged our backend. This small change made our traces and metrics far more useful.
Problem 4: Missing Kubernetes metadata in telemetry
Our services ran in Kubernetes, but the telemetry data lacked critical operational context. Spans and logs had no namespace, pod name, or deployment info. Without this context, debugging was inefficient. We could see a slow trace, but we couldn't immediately correlate it to a specific pod that might be resource-starved or a deployment that had just been rolled out. Adding labels manually in every app was not an option.
Solution: we used the k8sattributes processor to automatically enrich telemetry with Kubernetes metadata.
processors:
  k8sattributes:
    passthrough: false
    auth_type: serviceAccount
    pod_association:
      - sources:
          - from: resource_attribute
            name: k8s.pod.ip
    extract:
      metadata
This attaches metadata like namespace, pod name, and deployment to each span and log. Now every span and log includes fields that make filtering and building dashboards much more powerful.
A word of caution: adding these attributes, especially high-cardinality ones (like
k8s.pod.id,k8s.node.id), increases your payload size and can significantly drive up costs, particularly for metrics. Additionally, in environments with autoscaling, a pod ID you see in telemetry might have already been terminated or scaled in by the time you debug. Be selective about which attributes you attach to which signals to balance observability and cost.
Problem 5: High-volume traces but no signal
With tracing turned on everywhere, our backend was flooded with thousands of traces per minute. During incidents, the important traces those with errors, timeouts, or high latency were buried under a mountain of successful 200-OK requests. It felt like searching for a needle in a haystack.
Why it happened: We were exporting everything. The traces we actually needed for debugging were a small fraction of the total volume.
Solution: We added the tail_sampling processor to keep only the traces that matter. Tail sampling waits until a trace is complete before deciding whether to keep it, allowing you to filter based on error status, latency, or other attributes.
Example Tail Sampling Config :
processors:
  tail_sampling:
    decision_wait: 30s
    policies:
      - name: errors-policy
        type: status_code
        status_code:
          status_codes:
	          - ERROR
	          - UNSET
      - name: keep-slow-traces
        type: latency
        latency:
          threshold_ms: 2000
      - name: randomized-policy
        type: probabilistic
        probabilistic:
          sampling_percentage: 10
This setup ensured we:
Always export traces with errors.
Export slow requests (latency ≥ 2000 ms).
Randomly sample 10% of all other traces for a baseline.
It's important to recognize that tail sampling is resource-intensive. The collector must hold all spans for a trace in memory while it waits for the trace to complete, which increases its compute and memory requirements. The policies are also highly flexible; for instance, you can add rules to filter based on span size, allowing you to drop exceptionally large spans unless they contain an error, further optimizing costs.
By carefully configuring these processors, we built a robust and efficient pipeline that delivered actionable insights without overwhelming our backend or our budget.
Conclusion
Scaling observability is less about simply enabling instrumentation and more about smart processing of telemetry data. OpenTelemetry makes it easy to collect traces, metrics, and logs, but making a pipeline production-ready requires careful design and the right processors.
In our case, we solved major challenges like rate limits, memory spikes, noisy telemetry, missing metadata, and high-volume traces by strategically using key processors and redesigning our Collector pipeline. This approach allowed us to control costs, maintain stability, and retain the telemetry that truly mattered.
The next time you enable telemetry, keep in mind that effective observability depends as much on how you process the data as it does on collecting it. A well-tuned collector pipeline can be the difference between actionable insights and overwhelming noise or worse, silent failure.
In the next post, we’ll dive into a particularly tricky challenge we faced while enabling tail sampling in a distributed system. You’ll see how we handled delayed traces, coordinated sampling decisions across multiple services, and ensured we captured the right data without overwhelming our backend.


