Setting the stage
It started like most engineering war stories: a deadline, a customer demo, and a feature that just had to ship.
The customer operated in the fraud detection and financial crime space. They had just rushed out a capability that surfaced AI-powered insights for fraud investigations and cost analytics. The underlying infrastructure was already there: a StarRocks data warehouse handling all their analytics needs - we've built similar zero-Ops data pipelines for fintech clients before.
The plan was simple - build on what already existed.
Powering this new feature was a CDC (change data capture) pipeline built on the Debezium Postgres connector, running inside Debezium Server - the standalone alternative to running Debezium inside Kafka Connect. Changes from a Postgres read replica would flow through the connector, hit a custom stateful service called the CDC Server, get transformed on the fly, and land in StarRocks. Clean, fast, and benchmarked on the development environment. (You sensed where I'm going with this)
The architecture, a bit unconventional, looked like this:
Debezium Server ran as a StatefulSet on Kubernetes, storing offsets on disk, connected to a Postgres read replica.
CDC Server - a custom stateful service also on Kubernetes with a Persistent Volume - listened to Debezium events over HTTP, transformed them, and wrote to StarRocks. It stored its own WAL, queue, and DLQ on disk and emitted Prometheus-compatible metrics.
A v2 was already planned that would swap the HTTP sink for RabbitMQ or GCP Pub/Sub.
a lesson we'd learned the hard way after enabling Kafka batching and breaking retries.
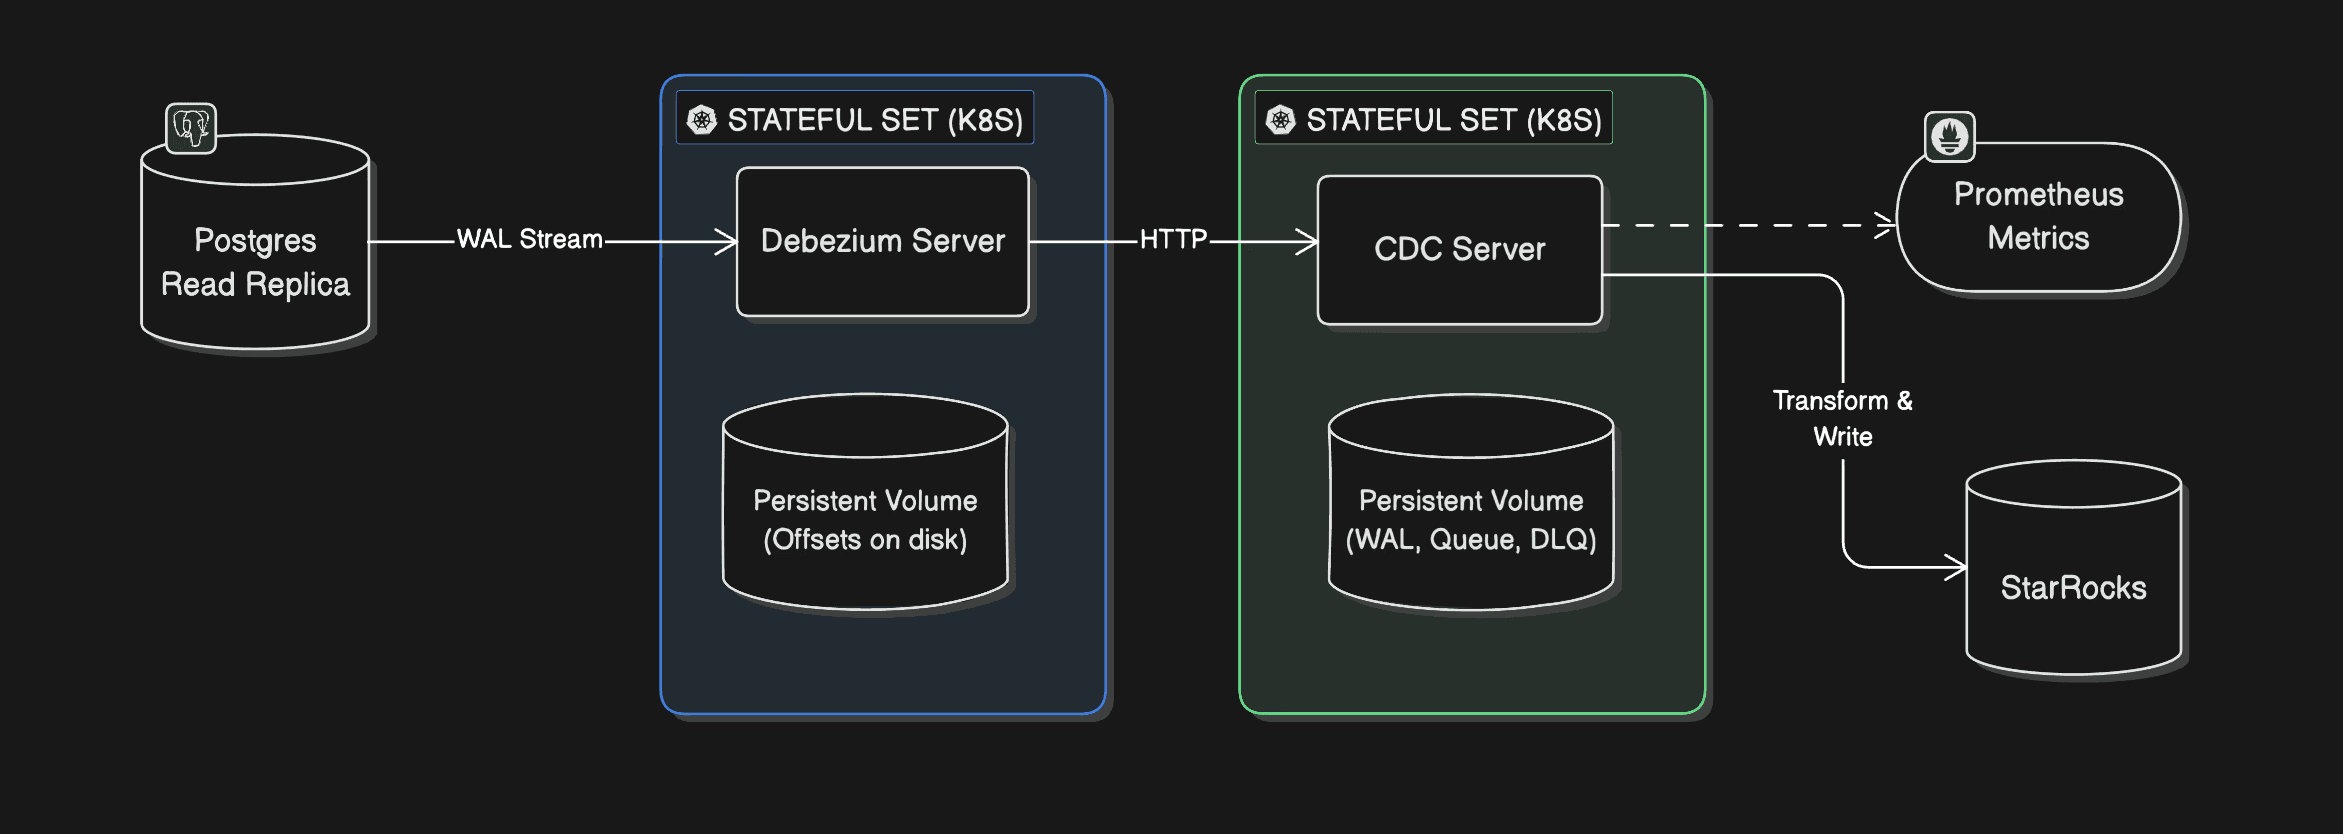
Fig: CDC Pipeline Architecture
On the development environment - a single VM, everything co-located - the pipeline hummed along beautifully. Sub-second latency. Benchmark numbers looked great. Everyone was happy.
Then the team promoted it to sandbox GKE cluster. And then to production GKE cluster.
And that's when things quietly, invisibly, started falling apart.
The ghost in the machine
Nobody noticed at first because nothing was loud about this failure.
Some tables would go hours without a single update - unless someone manually triggered a snapshot. The AI insights feature appeared to be working, right up until you squinted at the data and realized you were looking at hours-old information. No alarms went off. No pages fired. No Slack messages. Nothing that screamed "your replication is broken."
The end users, to their credit, weren't screaming. A few hours of delay in analytics? Tolerable. The team applied a short-term fix: re-snapshot the offending tables every few hours. Ship the demo. Keep moving.
But something was wrong, and everyone knew it.
The standard diagnostic queries told a suspiciously clean story:
SELECT * FROM
Flush lag: 0.02 seconds. Debezium's JMX metrics showed it was only 62 milliseconds behind the source. No replication lag.
The CDC Server logs? Clean. No events in the DLQ. No recorded event drops. No errors anywhere in the stack.
Three suspects went up on the board:
Is the CDC Server silently dropping events?
Is there an issue with Postgres logical replication from the read replica?
Is primary-to-secondary replication dropping WAL segments?
The team had no observability beyond infrastructure-level metrics and logs. No distributed tracing. No way to know if any HTTP requests to the CDC Server were failing mid-flight. They were debugging in the dark.
Temporary fix
We needed this feature. Rolling it back wasn't an option, and delaying the release wasn't either. It would bring the customer funding, and the customer's end users wanted something that none of the competitors had.
So we did a temporary fix:
Re-snapshot the source database every 6 hours in production, until we find the root cause.
Two weeks in: the first clue
Two weeks after the production rollout, an alert fired: Debezium had restarted.
That was the first real signal. Not a user complaint. Not a data quality alarm. Just a pod restart that someone caught because it showed up in infrastructure metrics.
The natural question was why it had restarted. Someone went digging, and this time ran a different query:
SELECT * FROM
The wal_status column came back as lost.
There it was. Debezium hadn't crashed because of a bug in the pipeline or a misconfiguration in the CDC Server - it had restarted because it lost its footing in the WAL. It came back up, re-established the replication slot, and carried on as if nothing had happened. Which is why nobody noticed a crash in the first place.
But why did the WAL get lost?
The answer turned out to be a Postgres parameter that nobody had thought to set on the secondary:
SHOW hot_standby_feedback;
-- false
hot_standby_feedback is a Postgres parameter used during logical decoding and streaming replication. It tells the primary about running queries on the replica so it delays vacuum cleanup of tuples those queries might still need. With it set to false, Postgres was free to clean up WAL segments that Debezium was still in the middle of reading. Eventually the replication slot would lose its position, Debezium would hit an error it couldn't recover from gracefully, and it would restart - silently, automatically, leaving no trace except a pod restart event and hours of missing data downstream.
The hotfix was quick: enable hot_standby_feedback on the secondary, re-snapshot the database, and move on. The team noted it as resolved, closed the loop internally, and got back to customer demos.
The snapshots every six hours kept working. The read replica was fine. Life appeared to continue.
The real problem was still there
It was only when a significant customer came back with a new set of requirements - features X, Y, Z, and T - that the stakes changed overnight.
These features needed insights in no more than 30 minutes. Suddenly, "a few hours of delay" wasn't a product tradeoff anymore. It was a blocker. The customer was big enough that losing them wasn't an option.
An SRE (yeah, that's me) was pulled off everything else and handed this as a P0.
The investigation begins in earnest
The SRE's starting inventory was thin:
A development VM that worked fine with no issues.
Sandbox and production pipelines that failed to replicate data for specific tables.
No data points from the team on what had changed between environments.
The issue was not reproducible on development.
The approach was methodical:
Step 1: Try to reproduce the issue on the development VM.
Step 2: If it still doesn't reproduce, sniff the traffic between Debezium and the CDC Server. CDC Server can lie. Debezium can lie. tcpdump cannot.
I had previously written about live traffic interception in Kubernetes via Wireshark - no service mesh required - and this was exactly the moment it came in handy. Later, we applied the same approach to debug a tricky KubeVPN DNS issue. The steps were simple: act like an end user, trigger the happy path actions that should produce CDC events, and watch the wire.
What came back from Wireshark in sandbox was strange. Streaming replication was happening - but only for some tables.
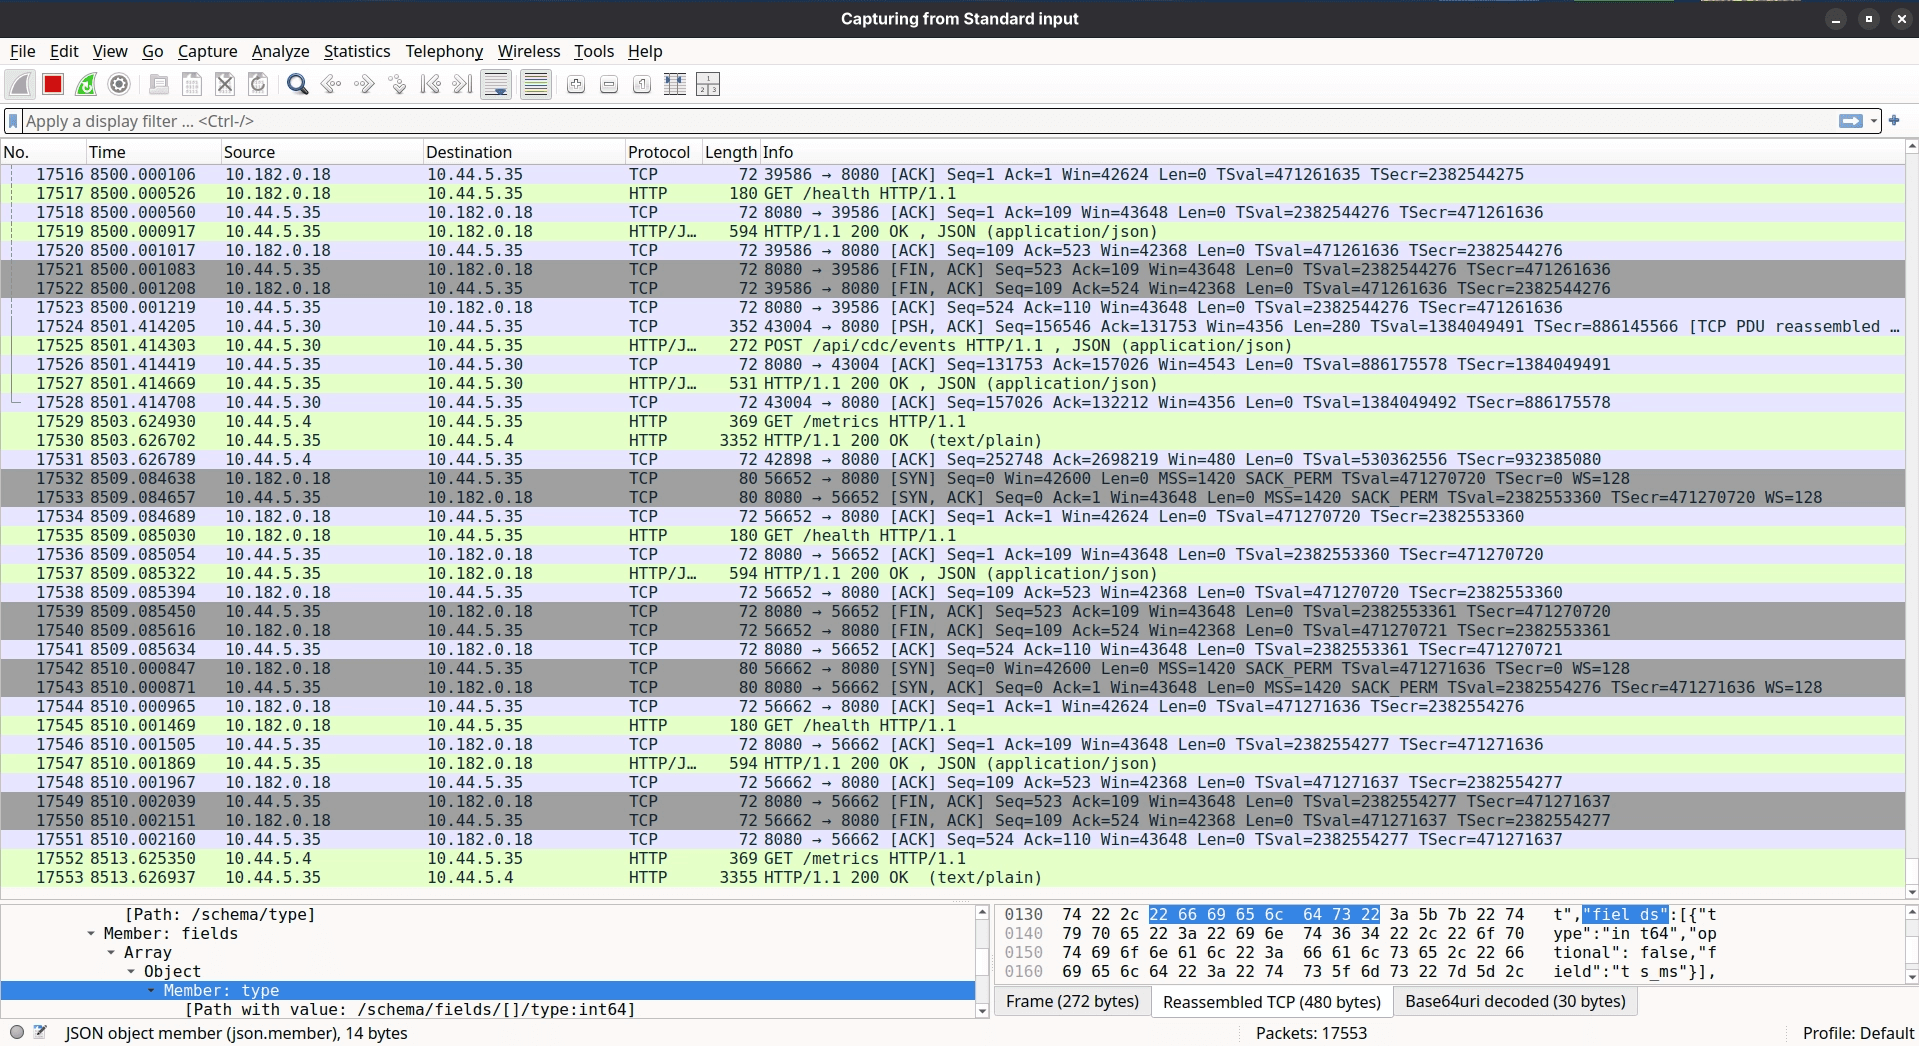
Fig: Live Sniffing (or Intercepting) traffic from cdc-server on Kubernetes using Wireshark.
A matrix was constructed. Every app-level action that should trigger replication for each table listed in Debezium's application.properties was mapped out and tested:
After working through the matrix, four tables emerged as consistently silent:
public.tbl_request_instancespublic.tbl_request_inputspublic.tbl_request_actor_inputspublic.tbl_request_actor_instances
Of course, these happened to be the four most critical tables for the AI Insights feature.
But the question that kept coming back: Why didn't it fail in development?
The moment of truth
The SRE connected to the development instance and ran a simple query:
SELECT * FROM pg_publication_tables WHERE pubname = 'dbz_publication'
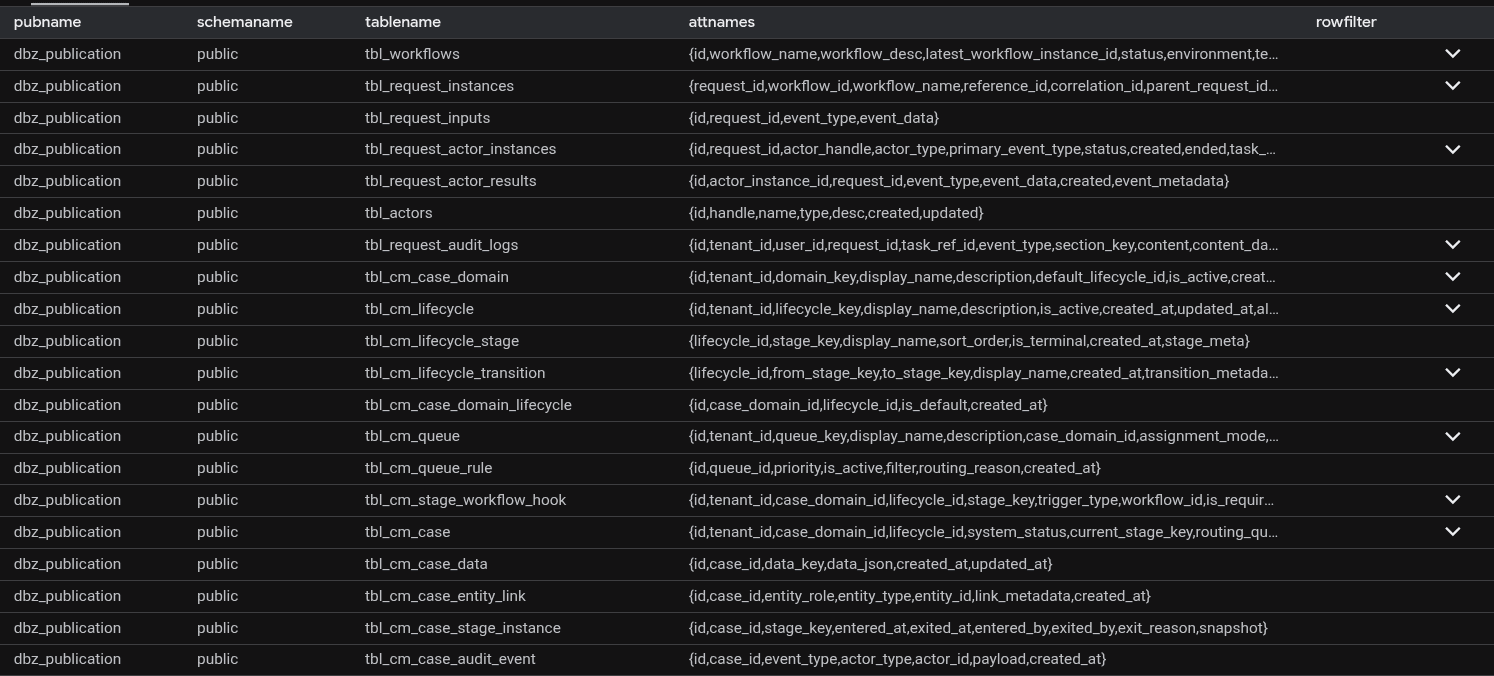
Then ran the equivalent on sandbox:
SELECT * FROM pg_publication_tables WHERE pubname = 'dbz_publication_2'
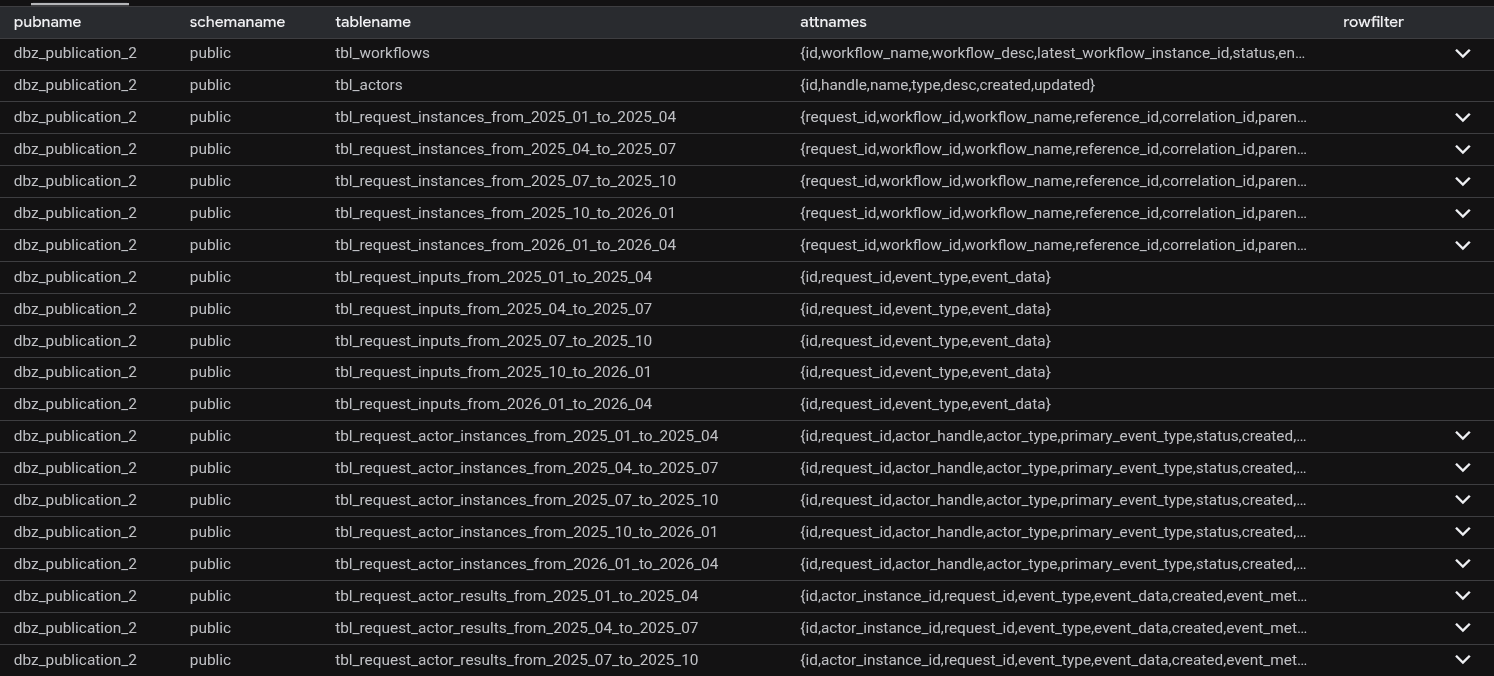
Staring at the two result sets side by side, something jumped out.
In sandbox and production, the publication included partition tables - for example, public.tbl_request_actor_instances_from_2025_04_to_2025_07 - but not the root table public.tbl_request_actor_instances as we saw in development
The tables that were silently failing in sandbox and production were partitioned tables. And the Debezium include list referenced the root table names, not the partition names.
Here's what was happening under the hood:
Postgres logical replication, by default, publishes changes at the partition level, not the root level. When a row was inserted into public.tbl_request_actor_instances, Postgres was actually routing it to a partition like tbl_request_actor_instances_from_2025_04_to_2025_07. Debezium received a change event for that partition - but its include list only knew about public.tbl_request_actor_instances. The event was silently discarded.
The development database happened to have a publication configured differently, which masked the problem entirely. Point the development Debezium config at the sandbox database: same issue, reproduced instantly.
The fix? One parameter, available since Postgres 13, when creating the publication:
CREATE PUBLICATION dbz_publication FOR TABLE [table list]
WITH (publish_via_partition_root = true);
-- If not specified, publish_via_partition_root defaults to false.
With publish_via_partition_root = true, Postgres publishes all partition changes under the root table name - exactly what Debezium's include list was expecting.
The fix
No code changes. No pipeline logic changes. No Debezium config changes.
The fix was:
Drop the existing publication.
Recreate it with
publish_via_partition_root = true.Redeploy the CDC pipeline and let it re-snapshot.
Both sandbox and production came back clean. The 30-minute latency requirement was met. The customer was retained.
What three weeks of debugging actually taught us
The root cause wasn't a bug. It wasn't even a misconfiguration in the traditional sense. It was a communication gap - a detail about how the Postgres publication was created that never made it into any handoff, runbook, or setup checklist.
The development environment's publication happened to behave differently from sandbox and production. That single divergence made the bug invisible for weeks, while the team chased WAL segments, replication slots, and HTTP traffic across two environments.
A few things stuck from this:
Speed creates gaps. When you're racing to ship a feature, the things that get skipped are often the things that matter most - environment parity, setup documentation, and the quiet "by the way" details that never make it into Jira tickets.
Blameless culture is load-bearing. At no point did the investigation turn into a search for who missed communicating the partition detail. That freed everyone to focus on the actual problem. When people are protecting themselves, they're not fixing things. This is why we teach reading SRE graphs without lying to yourself - the data should guide the conversation, not the blame.
Ownership follows safety. The team owned the failure completely. That's only possible in an environment where owning a failure doesn't mean becoming the failure. Blameless culture → more ownership → faster fixes → happier customers.
Push for environment parity. Environment drift is dangerous precisely because it’s invisible. Development ‘worked’ not because the system was correct, but because it was different: the publication was created differently, which masked the issue entirely.
Basics help. Where there’s a will, there’s a way. As an SRE it was very easy to call for a complete re-architecture of the pipeline. I had earned enough social currency with the customer. That’s not how N-gineers at One2N operate. We take on hard problems. Sure, we're still on track to implementing tracing, but that does not mean we can’t debug networking issues. tcpdump, a dead simple tool to analyze TCP traffic came to our rescue.
And one final note for anyone setting up Debezium with partitioned Postgres tables:
WITH (publish_via_partition_root = true)
Don't forget it.
If this post saved you some time, share it with the person on your team who's currently staring at clean Debezium logs and wondering why their tables aren't replicating. And if you're building CDC pipelines, observability platforms, or cloud-native data systems - we've been there. Schedule a 30-minute chat and let's talk about how we can help you ship faster and debug smarter.
Setting the stage
It started like most engineering war stories: a deadline, a customer demo, and a feature that just had to ship.
The customer operated in the fraud detection and financial crime space. They had just rushed out a capability that surfaced AI-powered insights for fraud investigations and cost analytics. The underlying infrastructure was already there: a StarRocks data warehouse handling all their analytics needs - we've built similar zero-Ops data pipelines for fintech clients before.
The plan was simple - build on what already existed.
Powering this new feature was a CDC (change data capture) pipeline built on the Debezium Postgres connector, running inside Debezium Server - the standalone alternative to running Debezium inside Kafka Connect. Changes from a Postgres read replica would flow through the connector, hit a custom stateful service called the CDC Server, get transformed on the fly, and land in StarRocks. Clean, fast, and benchmarked on the development environment. (You sensed where I'm going with this)
The architecture, a bit unconventional, looked like this:
Debezium Server ran as a StatefulSet on Kubernetes, storing offsets on disk, connected to a Postgres read replica.
CDC Server - a custom stateful service also on Kubernetes with a Persistent Volume - listened to Debezium events over HTTP, transformed them, and wrote to StarRocks. It stored its own WAL, queue, and DLQ on disk and emitted Prometheus-compatible metrics.
A v2 was already planned that would swap the HTTP sink for RabbitMQ or GCP Pub/Sub.
a lesson we'd learned the hard way after enabling Kafka batching and breaking retries.
Fig: CDC Pipeline Architecture
On the development environment - a single VM, everything co-located - the pipeline hummed along beautifully. Sub-second latency. Benchmark numbers looked great. Everyone was happy.
Then the team promoted it to sandbox GKE cluster. And then to production GKE cluster.
And that's when things quietly, invisibly, started falling apart.
The ghost in the machine
Nobody noticed at first because nothing was loud about this failure.
Some tables would go hours without a single update - unless someone manually triggered a snapshot. The AI insights feature appeared to be working, right up until you squinted at the data and realized you were looking at hours-old information. No alarms went off. No pages fired. No Slack messages. Nothing that screamed "your replication is broken."
The end users, to their credit, weren't screaming. A few hours of delay in analytics? Tolerable. The team applied a short-term fix: re-snapshot the offending tables every few hours. Ship the demo. Keep moving.
But something was wrong, and everyone knew it.
The standard diagnostic queries told a suspiciously clean story:
SELECT * FROM
Flush lag: 0.02 seconds. Debezium's JMX metrics showed it was only 62 milliseconds behind the source. No replication lag.
The CDC Server logs? Clean. No events in the DLQ. No recorded event drops. No errors anywhere in the stack.
Three suspects went up on the board:
Is the CDC Server silently dropping events?
Is there an issue with Postgres logical replication from the read replica?
Is primary-to-secondary replication dropping WAL segments?
The team had no observability beyond infrastructure-level metrics and logs. No distributed tracing. No way to know if any HTTP requests to the CDC Server were failing mid-flight. They were debugging in the dark.
Temporary fix
We needed this feature. Rolling it back wasn't an option, and delaying the release wasn't either. It would bring the customer funding, and the customer's end users wanted something that none of the competitors had.
So we did a temporary fix:
Re-snapshot the source database every 6 hours in production, until we find the root cause.
Two weeks in: the first clue
Two weeks after the production rollout, an alert fired: Debezium had restarted.
That was the first real signal. Not a user complaint. Not a data quality alarm. Just a pod restart that someone caught because it showed up in infrastructure metrics.
The natural question was why it had restarted. Someone went digging, and this time ran a different query:
SELECT * FROM
The wal_status column came back as lost.
There it was. Debezium hadn't crashed because of a bug in the pipeline or a misconfiguration in the CDC Server - it had restarted because it lost its footing in the WAL. It came back up, re-established the replication slot, and carried on as if nothing had happened. Which is why nobody noticed a crash in the first place.
But why did the WAL get lost?
The answer turned out to be a Postgres parameter that nobody had thought to set on the secondary:
SHOW hot_standby_feedback;
-- false
hot_standby_feedback is a Postgres parameter used during logical decoding and streaming replication. It tells the primary about running queries on the replica so it delays vacuum cleanup of tuples those queries might still need. With it set to false, Postgres was free to clean up WAL segments that Debezium was still in the middle of reading. Eventually the replication slot would lose its position, Debezium would hit an error it couldn't recover from gracefully, and it would restart - silently, automatically, leaving no trace except a pod restart event and hours of missing data downstream.
The hotfix was quick: enable hot_standby_feedback on the secondary, re-snapshot the database, and move on. The team noted it as resolved, closed the loop internally, and got back to customer demos.
The snapshots every six hours kept working. The read replica was fine. Life appeared to continue.
The real problem was still there
It was only when a significant customer came back with a new set of requirements - features X, Y, Z, and T - that the stakes changed overnight.
These features needed insights in no more than 30 minutes. Suddenly, "a few hours of delay" wasn't a product tradeoff anymore. It was a blocker. The customer was big enough that losing them wasn't an option.
An SRE (yeah, that's me) was pulled off everything else and handed this as a P0.
The investigation begins in earnest
The SRE's starting inventory was thin:
A development VM that worked fine with no issues.
Sandbox and production pipelines that failed to replicate data for specific tables.
No data points from the team on what had changed between environments.
The issue was not reproducible on development.
The approach was methodical:
Step 1: Try to reproduce the issue on the development VM.
Step 2: If it still doesn't reproduce, sniff the traffic between Debezium and the CDC Server. CDC Server can lie. Debezium can lie. tcpdump cannot.
I had previously written about live traffic interception in Kubernetes via Wireshark - no service mesh required - and this was exactly the moment it came in handy. Later, we applied the same approach to debug a tricky KubeVPN DNS issue. The steps were simple: act like an end user, trigger the happy path actions that should produce CDC events, and watch the wire.
What came back from Wireshark in sandbox was strange. Streaming replication was happening - but only for some tables.
Fig: Live Sniffing (or Intercepting) traffic from cdc-server on Kubernetes using Wireshark.
A matrix was constructed. Every app-level action that should trigger replication for each table listed in Debezium's application.properties was mapped out and tested:
After working through the matrix, four tables emerged as consistently silent:
public.tbl_request_instancespublic.tbl_request_inputspublic.tbl_request_actor_inputspublic.tbl_request_actor_instances
Of course, these happened to be the four most critical tables for the AI Insights feature.
But the question that kept coming back: Why didn't it fail in development?
The moment of truth
The SRE connected to the development instance and ran a simple query:
SELECT * FROM pg_publication_tables WHERE pubname = 'dbz_publication'
Then ran the equivalent on sandbox:
SELECT * FROM pg_publication_tables WHERE pubname = 'dbz_publication_2'
Staring at the two result sets side by side, something jumped out.
In sandbox and production, the publication included partition tables - for example, public.tbl_request_actor_instances_from_2025_04_to_2025_07 - but not the root table public.tbl_request_actor_instances as we saw in development
The tables that were silently failing in sandbox and production were partitioned tables. And the Debezium include list referenced the root table names, not the partition names.
Here's what was happening under the hood:
Postgres logical replication, by default, publishes changes at the partition level, not the root level. When a row was inserted into public.tbl_request_actor_instances, Postgres was actually routing it to a partition like tbl_request_actor_instances_from_2025_04_to_2025_07. Debezium received a change event for that partition - but its include list only knew about public.tbl_request_actor_instances. The event was silently discarded.
The development database happened to have a publication configured differently, which masked the problem entirely. Point the development Debezium config at the sandbox database: same issue, reproduced instantly.
The fix? One parameter, available since Postgres 13, when creating the publication:
CREATE PUBLICATION dbz_publication FOR TABLE [table list]
WITH (publish_via_partition_root = true);
-- If not specified, publish_via_partition_root defaults to false.
With publish_via_partition_root = true, Postgres publishes all partition changes under the root table name - exactly what Debezium's include list was expecting.
The fix
No code changes. No pipeline logic changes. No Debezium config changes.
The fix was:
Drop the existing publication.
Recreate it with
publish_via_partition_root = true.Redeploy the CDC pipeline and let it re-snapshot.
Both sandbox and production came back clean. The 30-minute latency requirement was met. The customer was retained.
What three weeks of debugging actually taught us
The root cause wasn't a bug. It wasn't even a misconfiguration in the traditional sense. It was a communication gap - a detail about how the Postgres publication was created that never made it into any handoff, runbook, or setup checklist.
The development environment's publication happened to behave differently from sandbox and production. That single divergence made the bug invisible for weeks, while the team chased WAL segments, replication slots, and HTTP traffic across two environments.
A few things stuck from this:
Speed creates gaps. When you're racing to ship a feature, the things that get skipped are often the things that matter most - environment parity, setup documentation, and the quiet "by the way" details that never make it into Jira tickets.
Blameless culture is load-bearing. At no point did the investigation turn into a search for who missed communicating the partition detail. That freed everyone to focus on the actual problem. When people are protecting themselves, they're not fixing things. This is why we teach reading SRE graphs without lying to yourself - the data should guide the conversation, not the blame.
Ownership follows safety. The team owned the failure completely. That's only possible in an environment where owning a failure doesn't mean becoming the failure. Blameless culture → more ownership → faster fixes → happier customers.
Push for environment parity. Environment drift is dangerous precisely because it’s invisible. Development ‘worked’ not because the system was correct, but because it was different: the publication was created differently, which masked the issue entirely.
Basics help. Where there’s a will, there’s a way. As an SRE it was very easy to call for a complete re-architecture of the pipeline. I had earned enough social currency with the customer. That’s not how N-gineers at One2N operate. We take on hard problems. Sure, we're still on track to implementing tracing, but that does not mean we can’t debug networking issues. tcpdump, a dead simple tool to analyze TCP traffic came to our rescue.
And one final note for anyone setting up Debezium with partitioned Postgres tables:
WITH (publish_via_partition_root = true)
Don't forget it.
If this post saved you some time, share it with the person on your team who's currently staring at clean Debezium logs and wondering why their tables aren't replicating. And if you're building CDC pipelines, observability platforms, or cloud-native data systems - we've been there. Schedule a 30-minute chat and let's talk about how we can help you ship faster and debug smarter.
In this post
In this post
Section
Share
Share
In this post
section
Share
Keywords
PostgreSQL, Debezium, CDC, Logical Replication, Data Engineering, SRE, Kubernetes, Partitioned Tables, WAL, StarRocks, Kafka, Site Reliability Engineering, Streaming Replication, Blameless Culture, Environment Parity